Key takeaways
- A data centre drawing 91 GWh a year, about a 10 MW IT load, paid on average between €0.071 per kWh in Norway and €0.180 in Ireland in the first half of 2026. Prices exclude VAT and recoverable taxes. That is a 2.5-fold gap, or €9.9 million a year on the same load.
- The Nordic discount is narrowing. Against the first half of 2025, the average price in this band rose 60% in Norway, 55% in Finland and 31% in Sweden, while it fell 22% in Portugal and 9% in Spain. Norway, Finland and Sweden are still among the cheapest.
- Non-recoverable taxes and levies explain part of the gap: about 40% of the price in Poland and 16% in Germany, against under 1% in Norway, Sweden and Denmark.
- These are averages over every business in the band, not a data-centre tariff. Use them to compare markets, then price your own load with a supplier quote.
Eurostat updated its business electricity prices for the first half of 2026 on 13 October. They are the closest thing Europe has to a like-for-like answer to a siting team’s first cost question: what does a large consumer actually pay per kWh, network charges and levies included, in each country? For a data centre the answer ranges from €0.071 per kWh in Norway to €0.180 in Ireland.
This article reads those figures for a data-centre-sized load, works out the annual bill and shows how to repeat the sum for your own site. The prices are Eurostat’s; the sizing and the arithmetic are ours.
Which consumption band is a data centre?
Eurostat publishes prices for non-household consumers in seven bands of annual consumption. Take a 10 MW IT load running at 80% of its rating on average, in a building with a power usage effectiveness (PUE) of 1.3. It draws 10 × 0.8 × 1.3 × 8,760 hours = 91,104 MWh a year. That sits in the 70,000 to 150,000 MWh band. A campus above about 16 MW of IT load on the same assumptions crosses into the top band, 150,000 MWh or more. The table uses the price that excludes VAT and other recoverable taxes, the cost a business that can reclaim VAT actually carries (Eurostat methodology).
The prices, first half of 2026
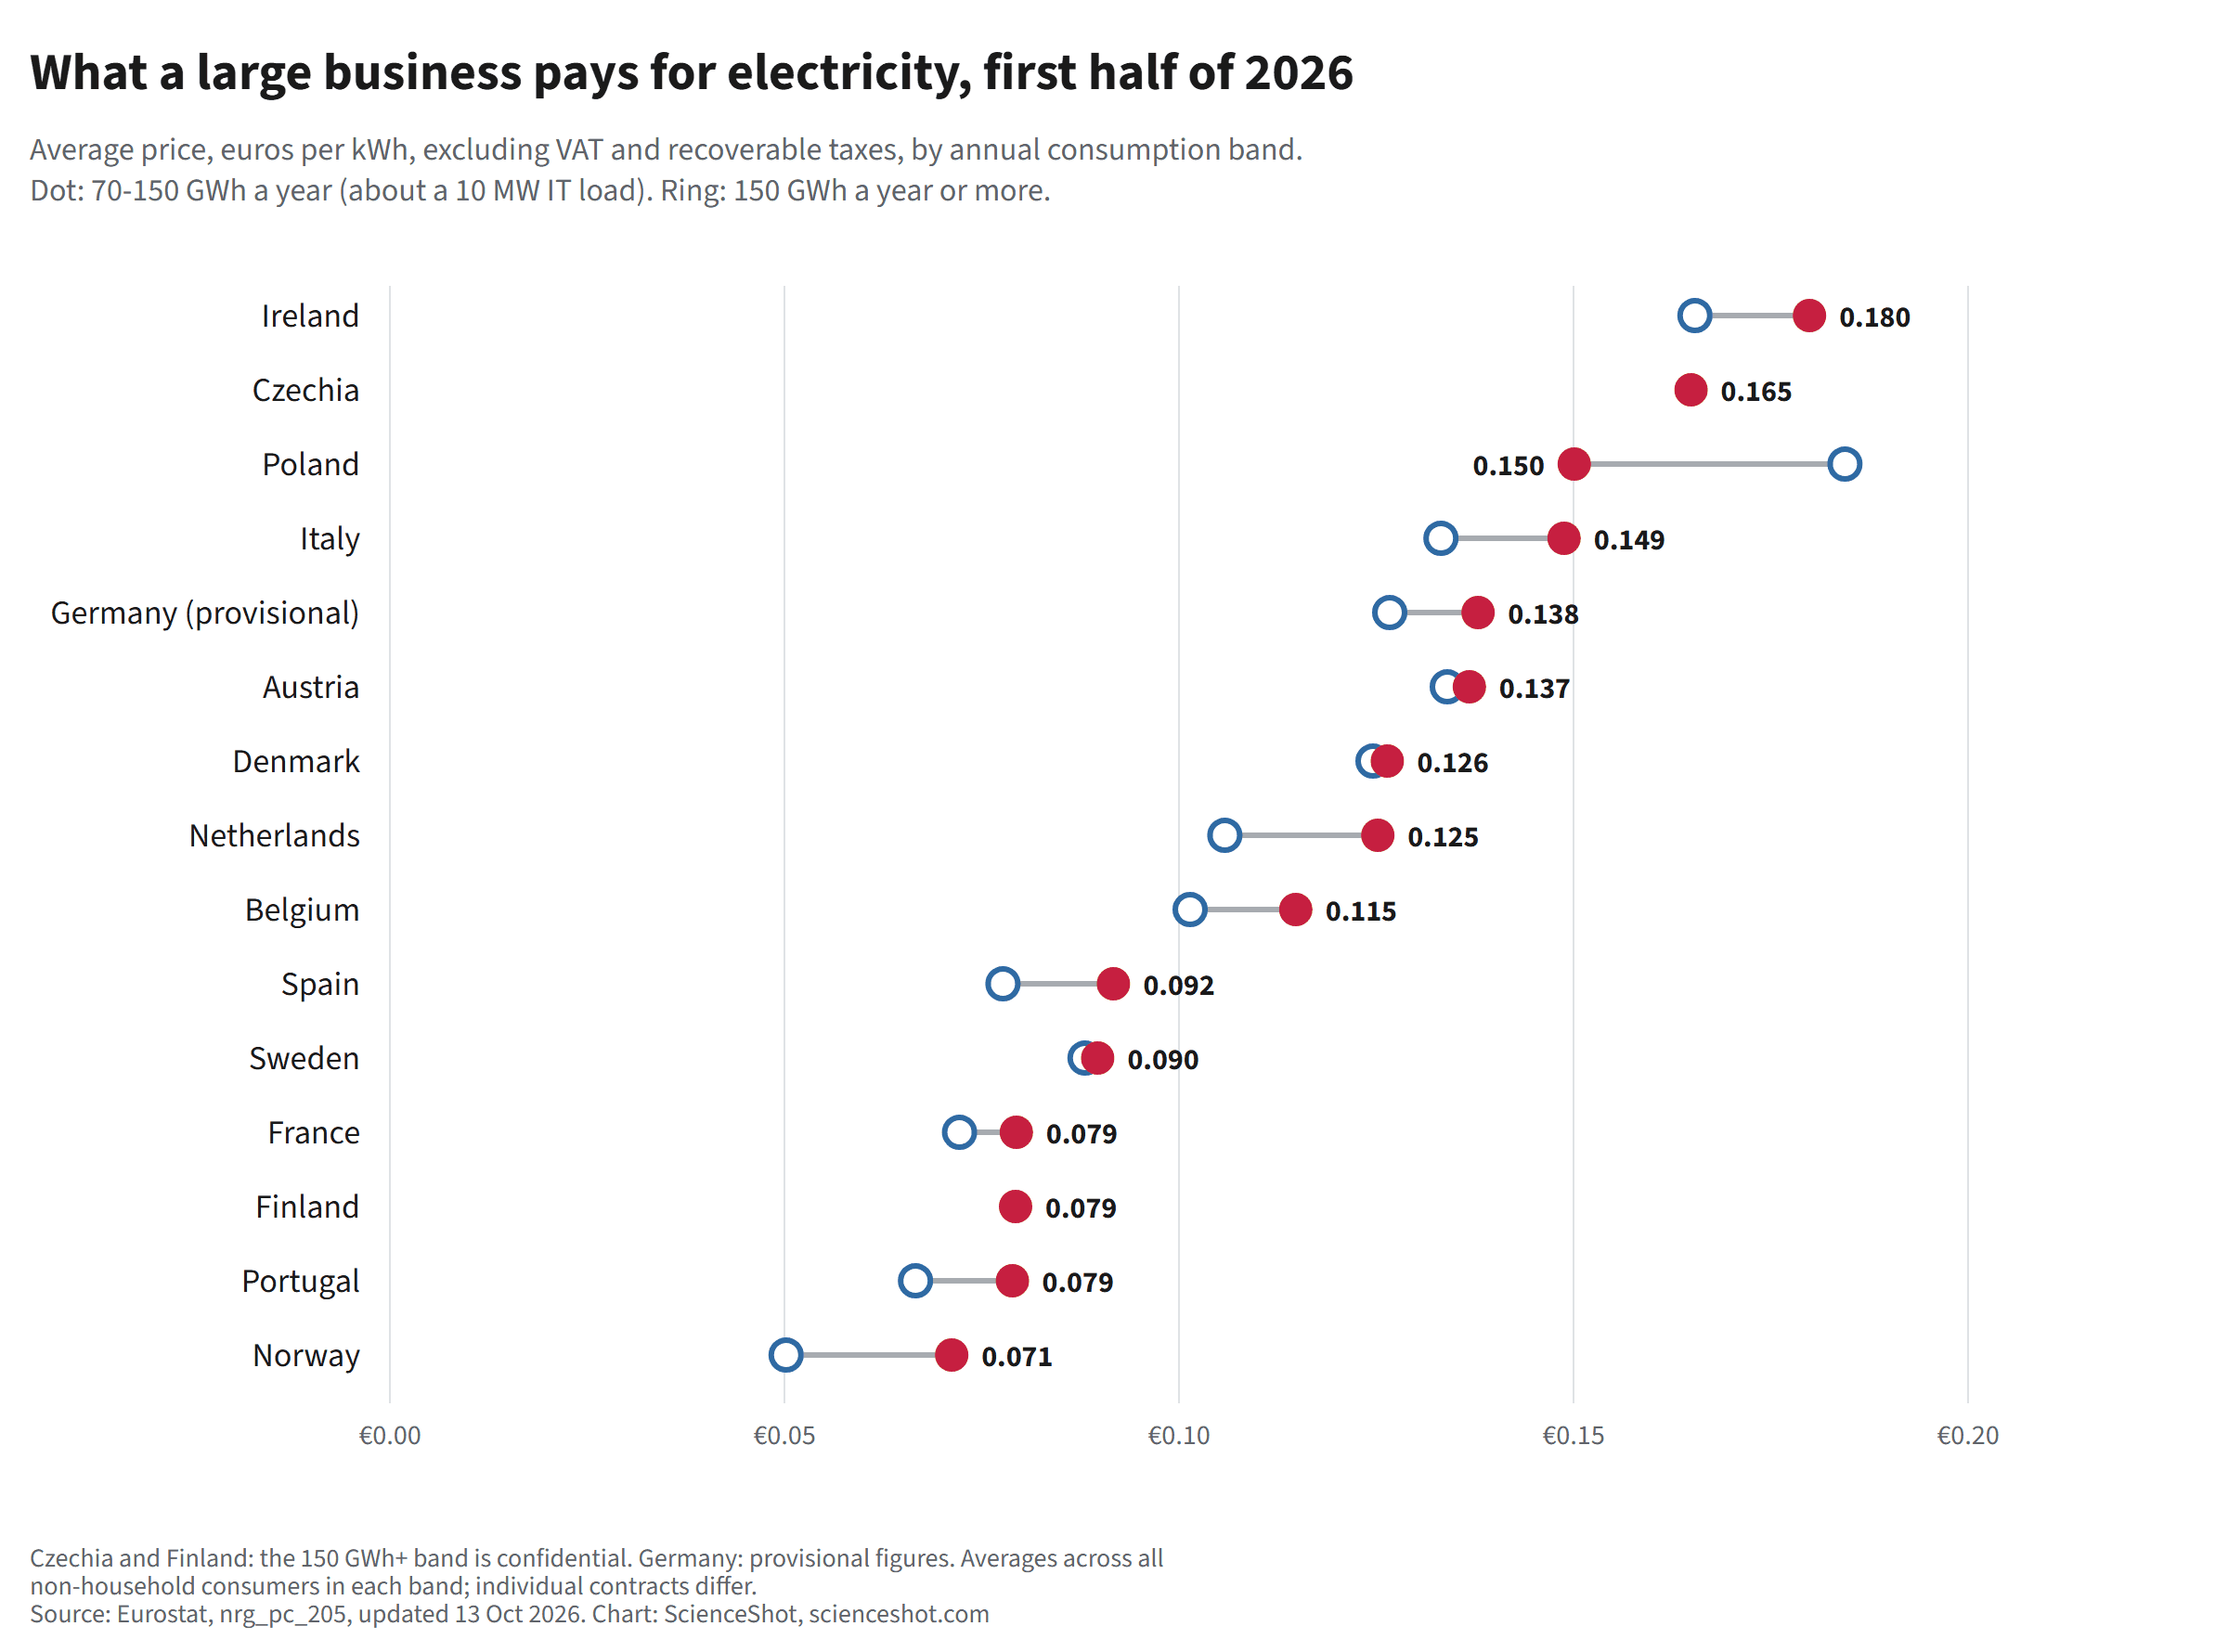
| Country | 70–150 GWh a year, €/kWh | 150 GWh a year or more, €/kWh | Change in the 70–150 GWh band since the first half of 2025 | Annual bill, 91 GWh at the 70–150 GWh price |
|---|---|---|---|---|
| Ireland | €0.180 | €0.165 | −8% | €16.4 million |
| Czechia | €0.165 | confidential | −4% | €15.0 million |
| Poland | €0.150 | €0.184 | +8% | €13.7 million |
| Italy | €0.149 | €0.133 | +2% | €13.6 million |
| Germany | €0.138 (provisional) | €0.127 (provisional) | −5% | €12.6 million |
| Austria | €0.137 | €0.134 | −3% | €12.5 million |
| Denmark | €0.126 | €0.125 | +5% | €11.5 million |
| Netherlands | €0.125 | €0.106 | −10% | €11.4 million |
| Belgium | €0.115 | €0.101 | −1% | €10.5 million |
| Spain | €0.092 | €0.078 | −9% | €8.4 million |
| Sweden | €0.090 | €0.088 | +31% | €8.2 million |
| France | €0.079 | €0.072 | −3% | €7.2 million |
| Finland | €0.079 | confidential | +55% | €7.2 million |
| Portugal | €0.079 | €0.067 | −22% | €7.2 million |
| Norway | €0.071 | €0.050 | +60% | €6.5 million |
Two oddities are worth knowing. In Poland the top band costs more on average than the band below it (€0.184 against €0.150). It has done so in every half-year since the start of 2024, before taxes as well as after. Eurostat gives no explanation, so treat the top-band figure for Poland with care. In Czechia and Finland the top-band price is marked confidential and not published.
The Nordic discount is narrowing
Norway, Sweden and Finland built their data-centre markets on cheap, clean power, and they are still at the cheap end; Denmark sits mid-table at €0.126. But in the 70 to 150 GWh band, average prices rose between the first halves of 2025 and 2026. Norway went from €0.044 to €0.071, Finland from €0.051 to €0.079 and Sweden from €0.068 to €0.090. Over the same year Portugal fell from €0.101 to €0.079 and Spain from €0.101 to €0.092. Portugal is now level with Finland and France, and Spain is close to Sweden.
One half-year against another is a short window, and Nordic prices swing with rainfall and reservoir levels. The point for a siting decision is narrower: a model that assumes a large, stable Nordic price advantage should be re-run with current figures. Our live grid page shows today’s wholesale prices and carbon intensity across the same markets.
Get the next one by email
Power, cooling, chips and the rules that shape them. No spam, unsubscribe any time.
The share you cannot reclaim
Eurostat also publishes the price with all taxes removed. The difference between that and the price used here is the part of the bill made up of taxes and levies a business cannot reclaim. In the 70 to 150 GWh band it was about 40% of the price in Poland, 16% in Germany and 10% in Austria, but under 1% in Norway, Sweden and Denmark. Some of these charges can be reduced for qualifying consumers, so a project’s own tax position can move its price more than the market average suggests.
Worked example: the same 10 MW load in three markets
- Ireland: 91,104 MWh × €0.180 = €16.4 million a year.
- Germany: 91,104 MWh × €0.138 (provisional) = €12.6 million a year.
- France: 91,104 MWh × €0.079 = €7.2 million a year.
Efficiency compounds the location choice. Every 0.1 of PUE on this load is 7,008 MWh a year. At the German average that is about €0.97 million a year, before any carbon or heat-reuse effect.
Run it for your own site
- Size the load with the AI workload energy calculator or your own IT plan: IT megawatts × average utilisation × PUE × 8,760 hours gives MWh a year, and the MWh tells you the band.
- Compare markets in the five-market comparison, which sets wholesale prices, grid carbon and cooling hours side by side. It uses the smaller 2,000 to 20,000 MWh band, so its prices are higher than the ones above.
- Take the result into the data-centre business case to see what the power price does to returns, and open the market page for grid connection status and the project pipeline.
Limits
These are average prices across all non-household consumers in each band, reported by national authorities, not data-centre tariffs. They include energy, network charges and non-recoverable levies, but a project’s real price depends on its contract, hedging, any power purchase agreement, its connection voltage and the reductions it qualifies for. German figures for the first half of 2026 are provisional. Changes are measured in euros, so for Norway, Sweden, Denmark, Poland and Czechia they include exchange-rate movements. Use the averages to rank markets and test assumptions, and a supplier quote to set a budget.
Cite this: ScienceShot, What does electricity cost a data centre in Europe?, October 2026, scienceshot.com, scienceshot.com/post/data-centre-electricity-price-europe-2026. Data: Eurostat, nrg_pc_205, updated 13 October 2026.
Cite this article
Turner, A. (2026, October 26). What does electricity cost a data centre in Europe? 2026 prices by country. ScienceShot. https://scienceshot.com/post/data-centre-electricity-price-europe-2026
Turner, Alex. “What does electricity cost a data centre in Europe? 2026 prices by country.” ScienceShot, 26 Oct. 2026, scienceshot.com/post/data-centre-electricity-price-europe-2026.
Turner, Alex. “What does electricity cost a data centre in Europe? 2026 prices by country.” ScienceShot, October 26, 2026. https://scienceshot.com/post/data-centre-electricity-price-europe-2026.
@online{scienceshot-data-centre-electricity-price-2026,
  author       = {Turner, Alex},
  title        = {{What does electricity cost a data centre in Europe? 2026 prices by country}},
  organization = {ScienceShot},
  date         = {2026-10-26},
  year         = {2026},
  url          = {https://scienceshot.com/post/data-centre-electricity-price-europe-2026}
}
https://scienceshot.com/post/data-centre-electricity-price-europe-2026
Get the weekly brief
Sourced analysis of data-centre engineering and regulation, every Monday. No spam, unsubscribe any time.