Key takeaways
- In September 2026 a constant load drew on grids averaging 24 gCO2e/kWh in south-west Norway (NO2) and 547 g in Poland, a gap of more than 20 times across the 12 markets we could rank.
- Timing roughly halved the carbon of a flexible load in Belgium, Germany, Spain and Great Britain. Running the same monthly energy in the cleanest quarter of hours took Belgium from 250 g to 105 g, Germany from 348 g to 166 g, Spain from 154 g to 77 g and Great Britain from 154 g to 77 g.
- Timing beat location only between grids of a similar kind. A perfectly flexible load in Germany (166 g) still ended up dirtier than a constant load in Spain or Great Britain (154 g), and far dirtier than one in France (36 g).
- A fixed midday block captured almost all the benefit in Spain (81 g against 77 g for full flexibility). In wind-driven Ireland the best fixed 4-hour block cut only 9%, against 46% for a load that could follow the wind.
- Where prices may be shown, the clean hours were also the cheap ones. In Germany the cleanest quarter of hours averaged EUR 48 per MWh on the day-ahead market, against EUR 152 across the same 665 hours with complete data (EUR 145 over all 720 hours of the month).
Where and when could a flexible data-centre load have run on the cleanest electricity in Europe in September 2026, and how much does choosing the hour matter next to choosing the country? We took every hour of the month for the markets on our live grid, computed carbon intensity with the same method and emission factors the live grid uses, and asked what a load that can wait would have gained. This is the first monthly edition of the European Grid Index for data centres. The next one covers October.
| Figure | Value | Period | Basis |
|---|---|---|---|
| Mean grid carbon intensity seen by a constant load, production-based lifecycle estimate | Norway (NO2) 24 g, Sweden (SE3) 30 g, France 36 g, Finland 54 g, Austria 77 g, Great Britain 154 g, Spain 154 g, Ireland 234 g, Belgium 250 g, Italy (North) 324 g, Germany 348 g, Poland 547 g (gCO2e/kWh) | 1 to 30 September 2026, hourly, UTC | Actual generation per production type; calculations ScienceShot |
The ranking: location sets the floor
The cleanest three grids ran on hydro and nuclear. South-west Norway ran mostly on hydro (86% of output, with wind supplying most of the rest) and averaged 24 g. Sweden’s SE3 zone, around Stockholm, averaged 30 g with nuclear supplying 59% of its output. France averaged 36 g, with nuclear at 72%. Finland (54 g) and Austria (77 g) follow, and every hour of the month in France, Norway and Sweden stayed under 100 g.
The large data-centre hubs sit further down. Great Britain and Spain tied at 154 g. Ireland averaged 234 g and Belgium 250 g. Italy’s northern zone, where Milan’s data centres sit, averaged 324 g and Germany 348 g. Poland, where hard coal and lignite supplied half of the output, averaged 547 g, and 98% of its hours were above 300 g.
Belgium had no nuclear output at all in September. Its two remaining reactors, Doel 4 and Tihange 3, were in planned outages covering the whole month, according to the published unavailability notices, and the Belgian grid operator’s own generation data show zero nuclear output since May 2026. The Belgian figure is therefore a fair account of what Belgian plants produced. It leaves out imports, like every figure here.
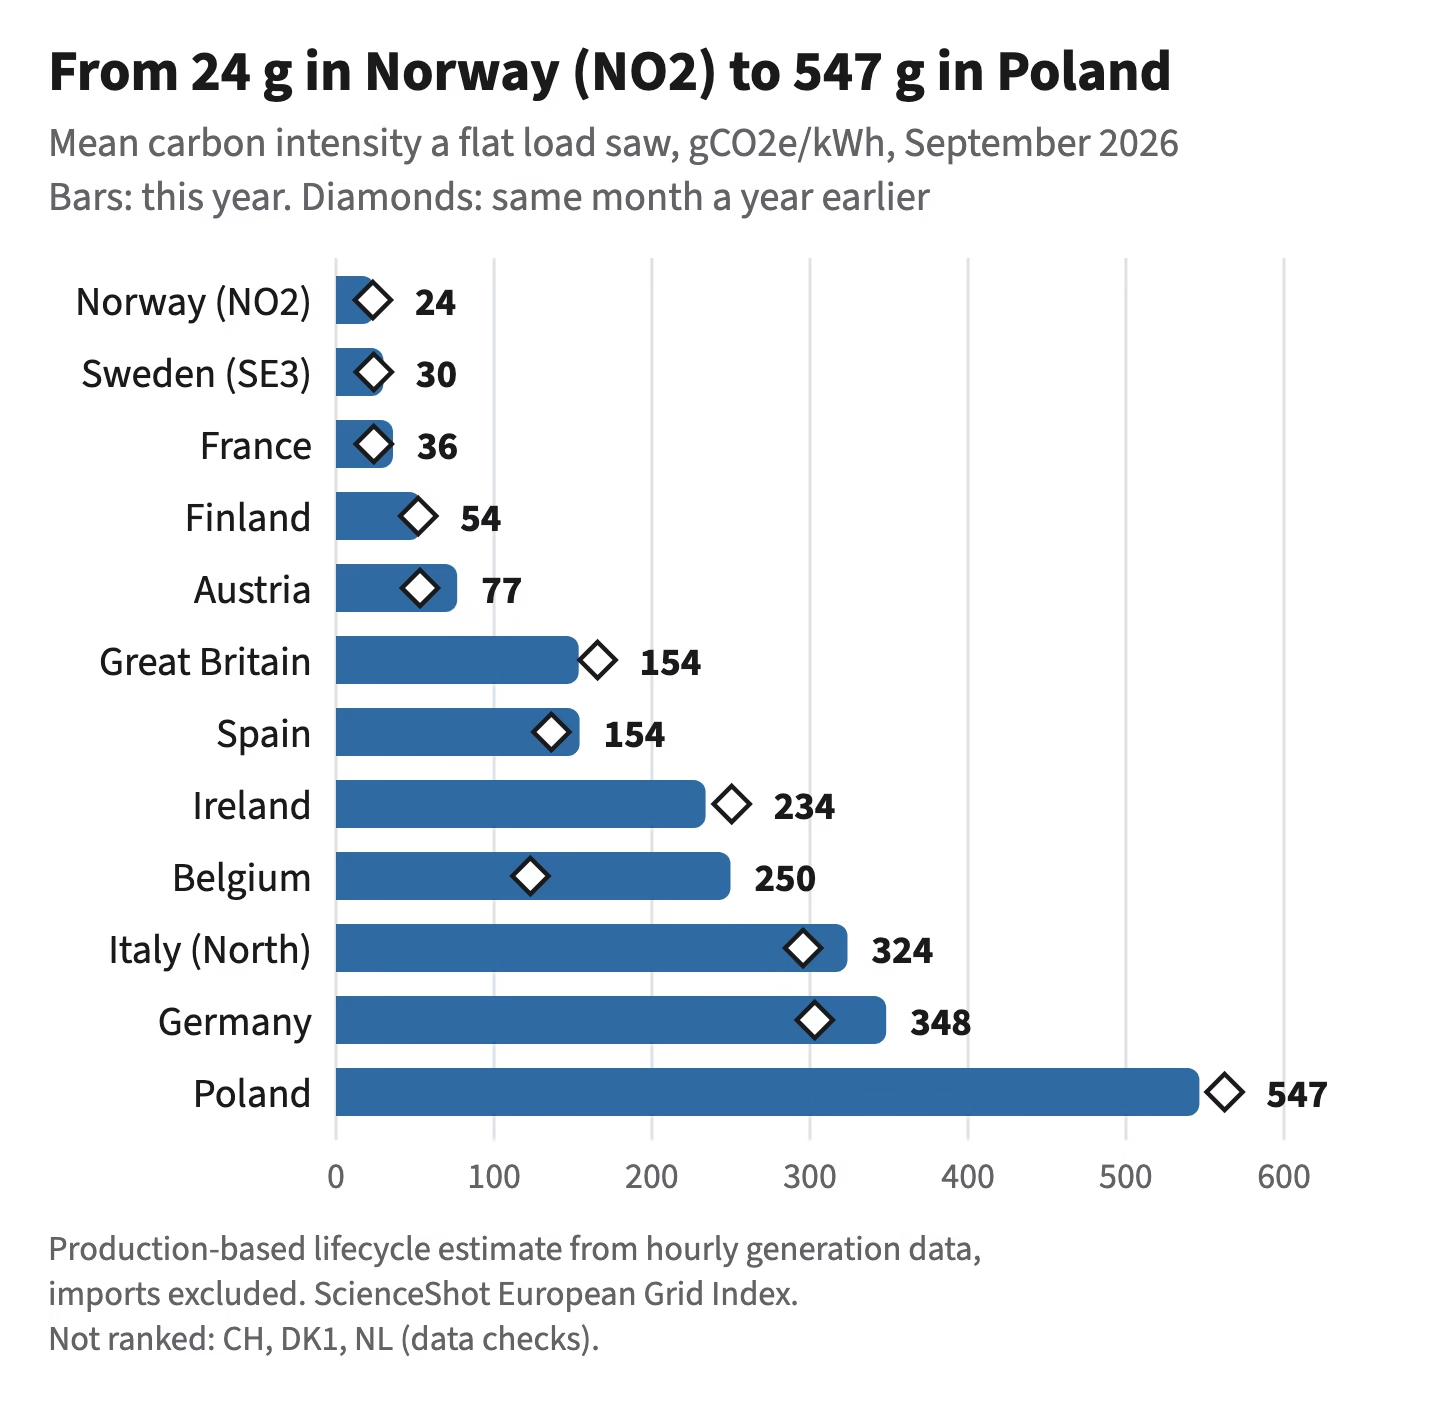
Against September 2025, computed the same way, Belgium more than doubled, from 123 g to 250 g: nuclear supplied 31% of Belgian output a year earlier and none this September. Germany rose 15% (303 g to 348 g), Spain 13% and Italy (North) 10%. Great Britain fell 7% and Poland 3%. In Germany the renewable share of output slipped from 66.9% to 63.5%. The low-carbon grids moved by 1 to 24 grams: Norway from 23 g to 24 g, France from 24 g to 36 g, Austria from 53 g to 77 g. Apart from Belgium, one September against another is a weather comparison as much as a trend, because wind and hydro output swing from year to year.
Hour by hour: solar sets a daily rhythm
Averaging each hour of the day across the month shows two kinds of grid. In Belgium, Germany, Spain, Italy, Poland and Austria the cleanest four hours fall between late morning and mid-afternoon, when solar output peaks. Belgium’s 12:00 to 16:00 block averaged 126 g, 49% below its monthly mean. Germany’s 11:00 to 15:00 block averaged 181 g, 48% below, and Spain’s 12:00 to 16:00 block 81 g, 47% below.
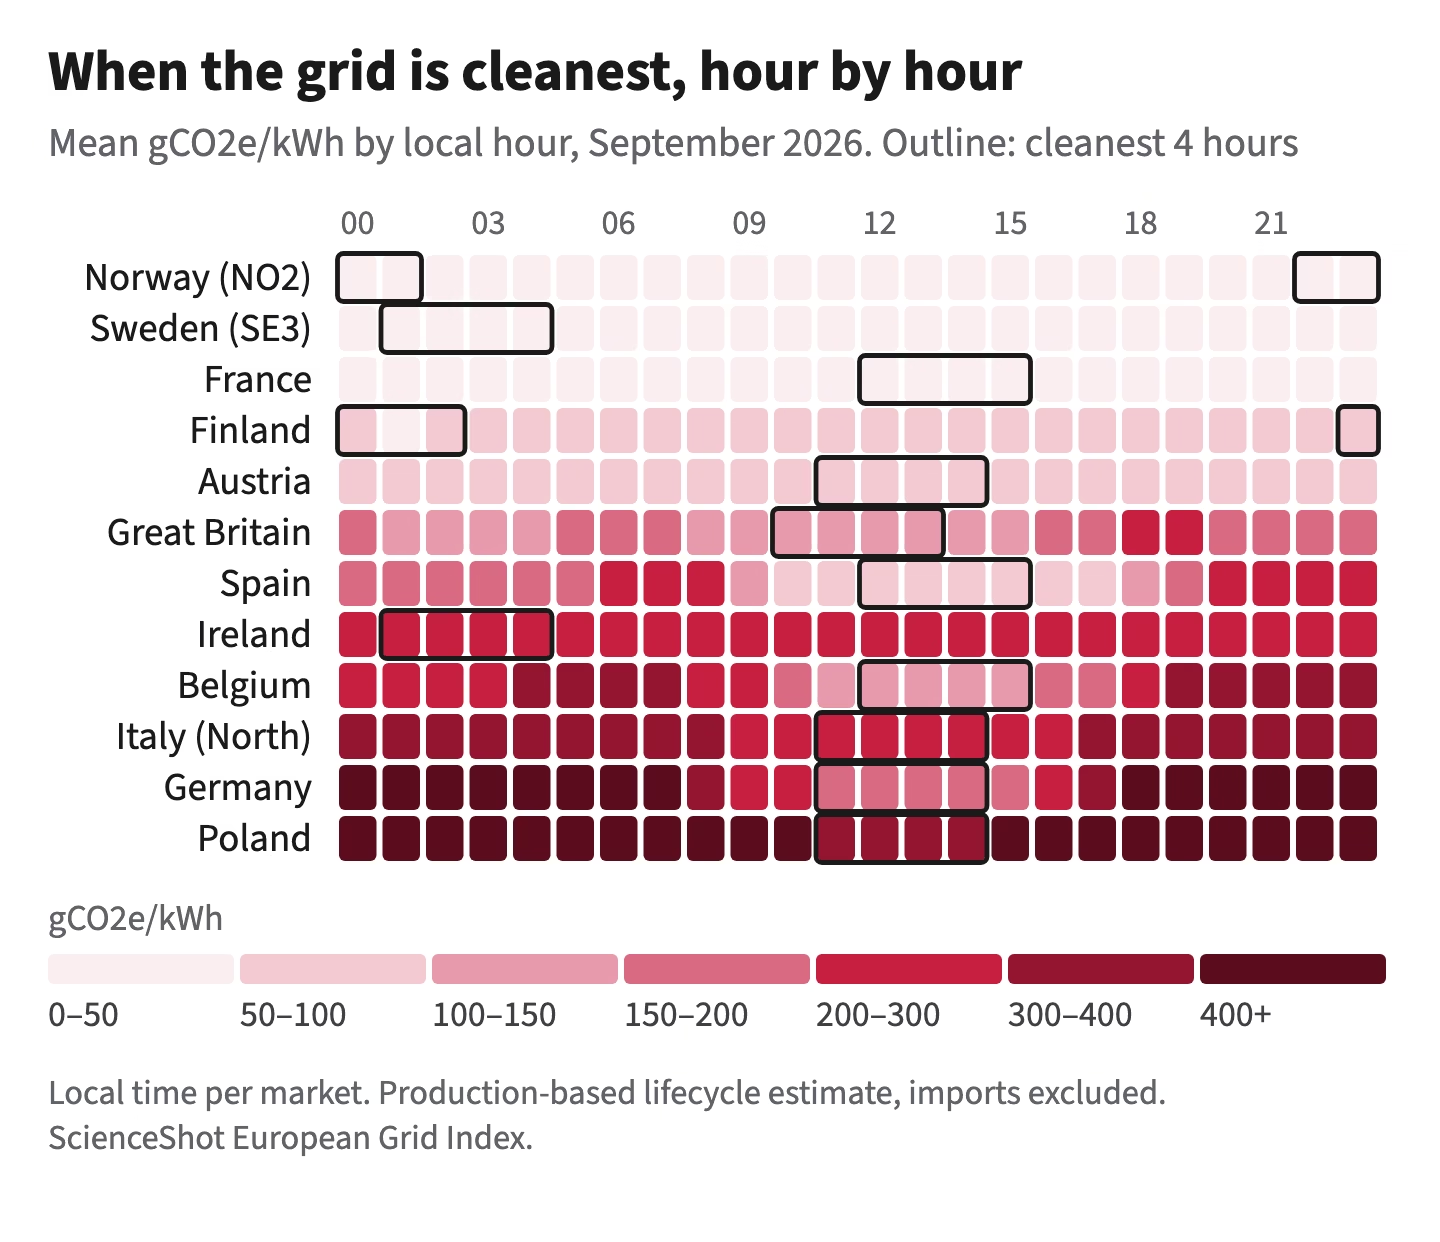
Ireland shows no daily pattern of that kind. Its grid is driven by wind, which follows weather systems over days. Its cleanest 4-hour block on average, 01:00 to 05:00, was only 9% below the monthly mean. Great Britain sits in between: its 10:00 to 14:00 block was 28% below. In both, the evening peak around 19:00 was the dirtiest hour of the day.
| Market | Cleanest 4 hours (local) | Mean in that block (g) | Below the monthly mean |
|---|---|---|---|
| Belgium | 12:00 to 16:00 | 126 | 49% |
| Germany | 11:00 to 15:00 | 181 | 48% |
| Spain | 12:00 to 16:00 | 81 | 47% |
| Poland | 11:00 to 15:00 | 384 | 30% |
| Italy (North) | 11:00 to 15:00 | 230 | 29% |
| Great Britain | 10:00 to 14:00 | 111 | 28% |
| Austria | 11:00 to 15:00 | 56 | 26% |
| France | 12:00 to 16:00 | 29 | 20% |
| Ireland | 01:00 to 05:00 | 213 | 9% |
| Sweden (SE3) | 01:00 to 05:00 | 27 | 9% |
| Finland | 23:00 to 03:00 | 50 | 7% |
| Norway (NO2) | 22:00 to 02:00 | 24 | 1% |
Timing against location
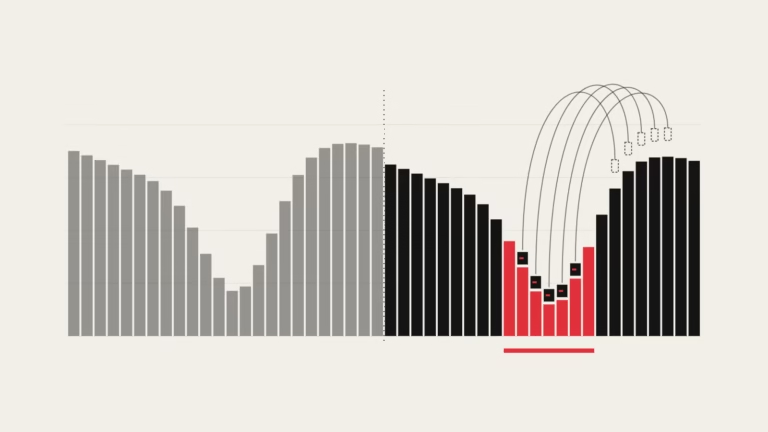
To put a number on timing, we compared two loads with the same energy over the month. One runs flat. The other runs only in the month’s cleanest 25% of hours, at four times the power while it runs. That second load is an upper bound: it knows the future, needs four times the capacity and has no deadline to meet.
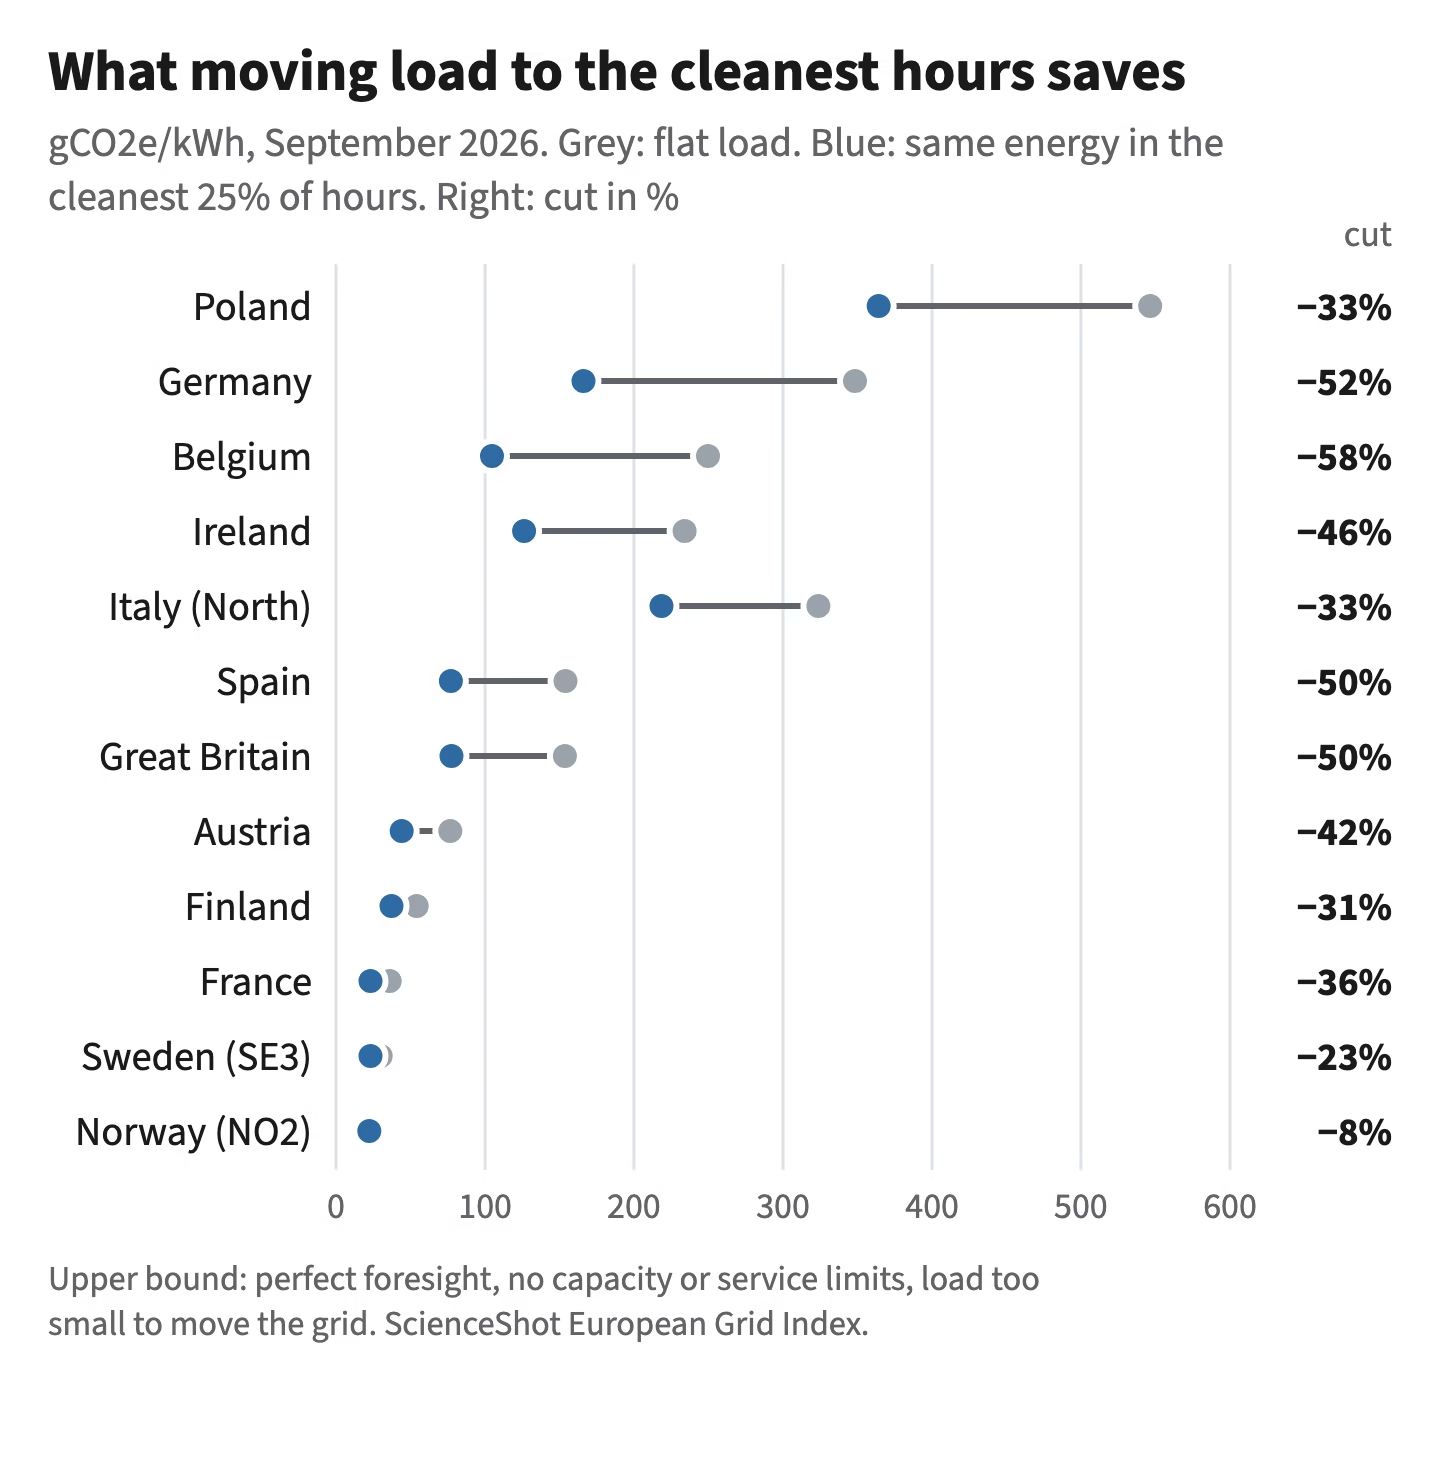
Belgium had the largest cut in percentage terms: the flexible load averaged 105 g, 58% below the flat 250 g. In Germany it averaged 166 g, a cut of 182 g or 52%. Spain and Great Britain halved, to 77 g each. Ireland fell 46%, Austria 42%, Italy (North) and Poland 33%. The hydro and nuclear grids saved only a few grams: 13 g in France, 7 g in Sweden, 2 g in Norway.
Across very different grids, moving the load did more than timing it. A German load that chased every clean hour (166 g) still ended up dirtier than a flat load in Spain or Great Britain (154 g), and more than four times a flat load in France (36 g). Moving a flat load from Germany to France would have cut 312 g; perfect timing in Germany cut 182 g. Between similar grids, timing wins. A flexible load in Belgium (105 g) beat a constant one in Spain or Great Britain (154 g), a flexible load in Spain (77 g) matched a constant load in Austria (77 g), and a flexible load in Italy’s northern zone (218 g) beat a constant one in Ireland (234 g).
Most real workloads cannot wait a week. So we also tested a stricter rule: each day’s energy runs in that day’s six cleanest hours. In solar grids this costs little. Spain reached 81 g against 77 g with full flexibility, Germany 198 g against 166 g. In wind grids the daily rule loses much of the gain. Ireland reached only a 24% cut against 46%, Great Britain 33% against 50%. Belgium kept a 50% cut against 58%. (Germany, Ireland and Belgium have days with gaps in the data; the daily test uses only complete days, 25, 20 and 14 of them.) A solar grid rewards a fixed midday schedule, while a wind grid rewards a load that can follow the forecast for days.
The 24/7 matching gap
A buyer who wants every hour covered by clean power is judged on the worst hours as much as on the average. The spread between a grid’s cleanest and dirtiest tenth of hours shows how hard that is. In Germany the cleanest tenth averaged 132 g and the dirtiest tenth 600 g, a gap of 468 g. Poland’s gap was 427 g, Ireland’s 348 g, Belgium’s 340 g, Italy (North) 245 g, Great Britain 219 g and Spain 191 g. In Norway it was 6 g.
| Market | Hours under 100 g | Hours over 300 g | Cleanest tenth (g) | Dirtiest tenth (g) | Renewable share |
|---|---|---|---|---|---|
| Norway (NO2) | 100% | 0% | 22 | 28 | 100% |
| Sweden (SE3) | 100% | 0% | 21 | 41 | 35% |
| France | 100% | 0% | 21 | 60 | 24% |
| Finland | 96% | 0% | 33 | 98 | 66% |
| Austria | 80% | 0% | 39 | 131 | 90% |
| Great Britain | 27% | 2% | 64 | 282 | 60% |
| Spain | 34% | 0% | 72 | 263 | 52% |
| Ireland | 1% | 27% | 112 | 460 | 62% |
| Belgium | 12% | 40% | 89 | 429 | 54% |
| Italy (North) | 0% | 71% | 159 | 404 | 32% |
| Germany | 1% | 59% | 132 | 600 | 63% |
| Poland | 0% | 98% | 323 | 750 | 35% |
A high renewable share does not guarantee a low intensity. Germany produced 63.5% of its September output from renewables and still averaged 348 g, because lignite and hard coal supplied almost a quarter of it. France produced 24% from renewables and averaged 36 g, because most of the rest was nuclear.
Were the clean hours also cheap?
We show day-ahead prices only where we can republish them. For this edition that means six ranked markets. In all six, the cleanest quarter of hours was cheaper than the month as a whole.
| Market | Mean day-ahead price (EUR/MWh) | Mean in the cleanest 25% of hours | Hours below zero |
|---|---|---|---|
| Germany | 152 | 48 | 25 |
| France | 143 | 105 | 27 |
| Belgium | 153 | 61 | 14 |
| Austria | 174 | 120 | 10 |
| Norway (NO2) | 131 | 98 | 10 |
| Italy (North) | 206 | 167 | 0 |
Germany shows the strongest link: across its valid hours, price and carbon intensity moved together with a correlation of 0.80. Its cheapest quarter of hours averaged 175 g, half the monthly mean. The table describes energy prices only. Network charges, taxes and the capacity a flexible load needs are not in it.
Prices were also much higher than a year earlier in all six markets. Over all hours of each month on the same price series, Germany’s September mean was EUR 145 per MWh against EUR 84 in September 2025, France’s EUR 143 against EUR 35 and Belgium’s EUR 156 against EUR 64. This edition does not examine the causes.
Get the next one by email
Power, cooling, chips and the rules that shape them. No spam, unsubscribe any time.
What it means for an operator
In this month’s data, siting decided more of a data centre’s grid carbon than timing did. A site in Germany or northern Italy that wants a low location-based figure cannot get there by timing alone. Timing is worth most in grids with large solar or wind swings and a fossil back-up: Belgium, Germany, Spain, Great Britain, Ireland and Austria this month. For a side-by-side view of five hubs on power cost, grid carbon, cooling climate and rules for a load you set, use our data-centre market comparison.
The flexible load in our model is generous. Real constraints shrink the gain:
- Capacity. Running a month’s energy in a quarter of the hours needs four times the average power, in servers, cooling and grid connection.
- Deadlines. Batch training, rendering and backups can wait hours; inference and transactional work cannot. Only the deferrable share of the load sees any of the cut, so a site where 20% of the energy can move gets about a fifth of these figures.
- Foresight. We picked the clean hours after the fact. A real scheduler works from forecasts, which miss.
- Accounting. These are average, location-based figures. A load that moves changes which plant runs at the margin, and the marginal intensity can differ a lot from the average. Market-based reporting with guarantees of origin or power purchase agreements is a separate calculation; the renewable-electricity duties that apply to data centres are in our European data-centre regulation tracker.
Three markets we did not rank
We computed all 15 live-grid markets and ranked the 12 whose source data passed our checks.
- Netherlands: the Dutch solar output in the hourly generation data is far too low. In the four months we checked against the official monthly electricity balance (September 2025 and May to July 2026), the hourly Dutch solar was 2% or less of the official figure, and in September 2026 it was 0.4% of reported output. A production-based estimate built on it overstates Dutch carbon intensity: our generation-weighted figure is 407 g, against 291 g in a published monthly estimate.
- Switzerland: our live grid uses a different data set for Swiss generation, because the hourly data used here differed from it by 53% in a check on 10 October.
- Denmark (DK1): our live grid uses a different data set here too, because the hourly data used here differed from it by 48% in the same check.
A market joins the ranking in a later edition once its source problem is resolved.
Method
- Period: 1 September 2026 00:00 to 1 October 2026 00:00 UTC, 720 hours.
- Data: actual generation per production type, as published hourly by the grid operators, for 14 bidding zones, the zones our live grid uses (DE-LU, FR, NL, Ireland’s all-island SEM, IT-North, ES, PL, BE, AT, CH, NO2, SE3, DK1, FI). Great Britain from its half-hourly generation mix, because the hourly data used for the other markets carries no British data.
- Carbon intensity per hour: the sum of each fuel’s output times a lifecycle emission factor, divided by total output. Imports are not counted. Pumped-storage output is left out, because counting it would count the energy that charged it twice. The factors are the live grid’s, in gCO2e/kWh: peat 1,100, lignite 1,000, hard coal 850, oil 650, gas 490, coal-derived gas 450, waste 350, other 300, biomass 230, solar 41, geothermal 38, hydro 24, nuclear 12, wind 12. Most are lifecycle medians from international assessments; lignite and hard coal come from national inventories; oil, waste and other are our own estimates. Peat and coal-derived gas are our conversions of default combustion factors from international inventory guidance (106 t CO2 per TJ for peat, 44.4 for coke-oven gas) at about 35% plant efficiency. They matter little here: peat is under 2% of output in Ireland and Finland, and coal-derived gas about 1% or less in Germany, Poland and northern Italy. Scoring coal-derived gas as blast-furnace gas instead (260 t CO2 per TJ) would raise Germany’s mean by about 5% and Poland’s by about 4%.
- An hour counts only if every fuel that reports in at least half the month and supplies at least 1% of output has a value in it. Germany kept 665 of 720 hours, Belgium 641 and Ireland 602; every other ranked market kept all 720. A market needs at least 80% of hours to be ranked.
- The monthly mean is the mean of hourly values, which is what a constant load sees. Hours of day use each market’s local time. Flexible load: the same monthly energy in the month’s cleanest 25% of valid hours; daily variant: each full day’s energy in that day’s six cleanest hours.
- Check: our generation-weighted figures for Germany (317 g), Spain (145 g) and Finland (52 g) sit 4% to 7% below an independent monthly estimate for September 2026 (334 g, 155 g and 54 g). That estimate uses its own factors (48 g for solar against our 41 g, and country-specific values for gas and coal), and its latest months may include estimates, so we expect close agreement with a small gap.
Source: ENTSO-E Transparency Platform (generation, 14 zones); NESO Carbon Intensity API, CC BY 4.0 (Great Britain); Bundesnetzagentur | SMARD.de, CC BY 4.0 (prices). Calculations ScienceShot.
Limits
- These are estimates. Lifecycle factors are medians, and a real plant’s emissions vary with its age and load.
- Production-based figures ignore imports. Grids that import heavily at some hours are described by their own plants only.
- The data depend on what grid operators report. Our completeness rule removes hours with a gap but cannot see a fuel that is never reported, which is why the Netherlands is not ranked.
- Great Britain’s figure comes from a different data set and is built from percentages of a generation mix. A published national intensity figure for the month averaged 108 g, lower than our 154 g, because it uses its own factors and counts imports.
- A single month has its own weather. September has neither winter demand nor the long days of June, and the year-on-year comparison carries a full year’s change in weather.
Citation and the next edition
How to cite: ScienceShot, European Grid Index for data centres, September 2026, https://scienceshot.com/post/european-grid-index-september-2026
For what the grid is doing right now, use the live European grid and its market pages, for example Germany, Belgium, Spain or Great Britain. Sites that want the live figures on their own pages can use our free grid-data embeds. The October edition follows in early November.
Cite this article
Turner, A. (2026, October 15). European Grid Index for data centres, September 2026. ScienceShot. https://scienceshot.com/post/european-grid-index-september-2026
Turner, Alex. “European Grid Index for data centres, September 2026.” ScienceShot, 15 Oct. 2026, scienceshot.com/post/european-grid-index-september-2026.
Turner, Alex. “European Grid Index for data centres, September 2026.” ScienceShot, October 15, 2026. https://scienceshot.com/post/european-grid-index-september-2026.
@online{scienceshot-european-grid-index-september-2026,
  author       = {Turner, Alex},
  title        = {{European Grid Index for data centres, September 2026}},
  organization = {ScienceShot},
  date         = {2026-10-15},
  year         = {2026},
  url          = {https://scienceshot.com/post/european-grid-index-september-2026}
}
https://scienceshot.com/post/european-grid-index-september-2026
Get the weekly brief
Sourced analysis of data-centre engineering and regulation, every Monday. No spam, unsubscribe any time.