
Key takeaways
- Moving flexible compute to cleaner hours or places generally lowers the emissions you report under the usual average, location-based accounting. Whether it lowers what the grid emits depends on which plant ramps up or down in that hour, and the European evidence on that is modelled, not measured (Sukprasert et al., 2024).
- The prize depends on the country. In 2025 Electricity Maps put France at 32.0 g CO2e/kWh and Sweden at 21.3 g on average, against 335.4 g for Germany and 676.6 g for Poland.
- Window length matters as much as location. In a model run on 2020 data, a nightly job in Germany saves almost nothing with a ±4 h window and 11.2% with ±8 h.
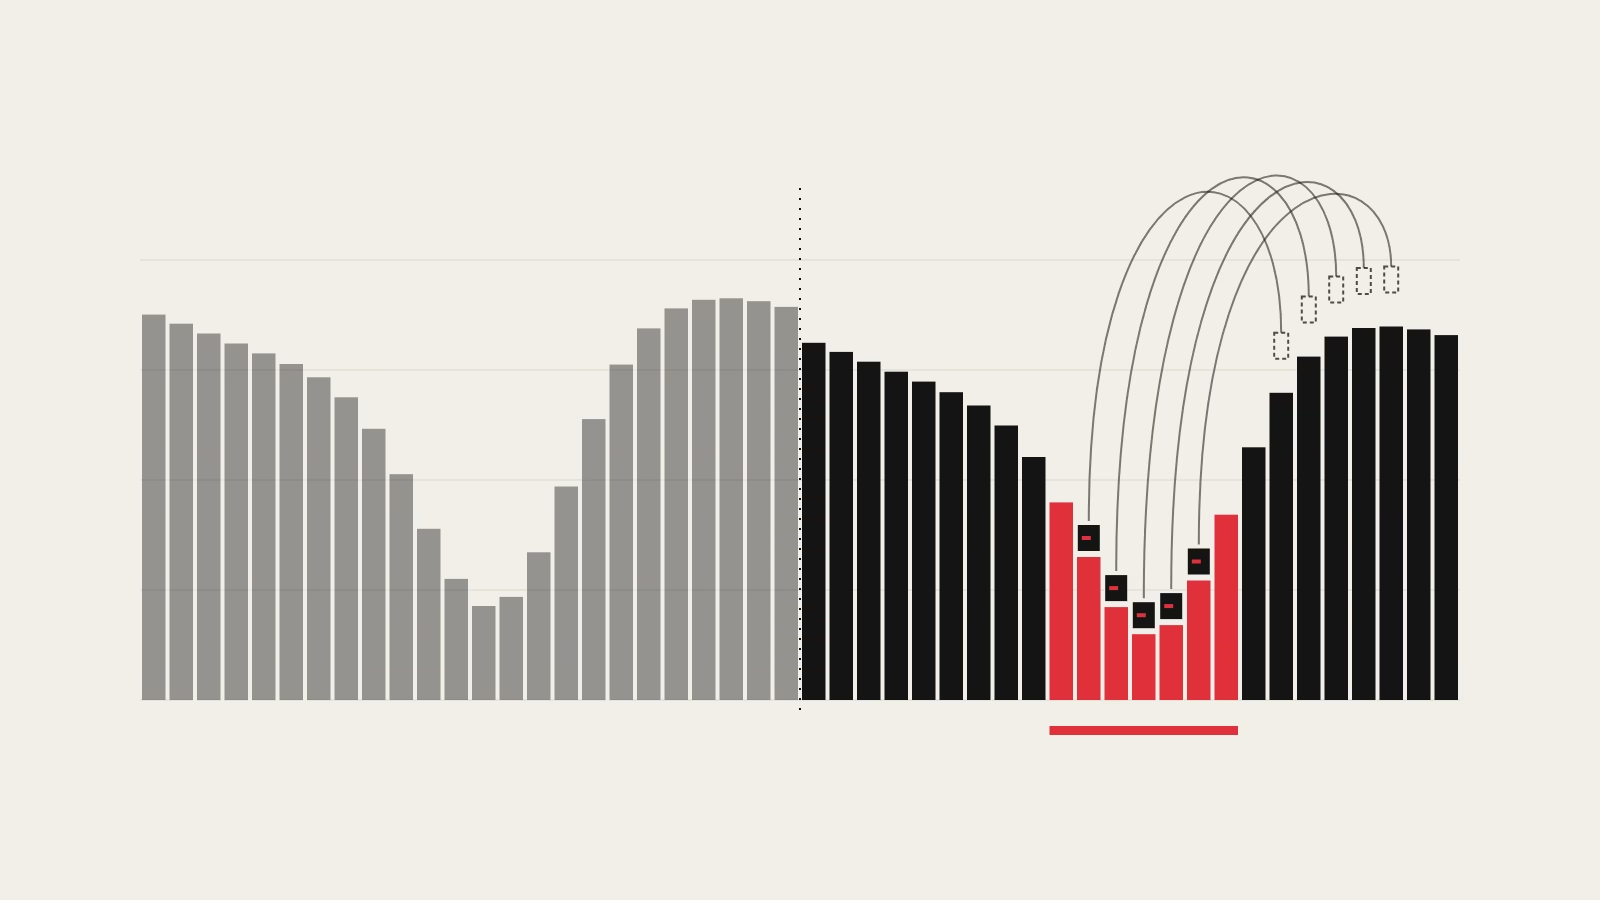
- In a randomised experiment at one Google campus, average cluster power fell 1% to 2% in the highest-carbon hours. On one illustrative day, a single cluster cut power by about 8% for six hours. The paper reports power, not tonnes of CO2e avoided.
- Reporting under Delegated Regulation (EU) 2024/1364 uses a calendar-year renewable ratio, and EnEfG section 11(5) says “bilanziell”. Neither text asks for hourly matching, so hourly shifting earns no visible credit in those reports today.
Shifting flexible compute to cleaner hours or cleaner countries cuts the emissions you report, but by very different amounts, and it does not always cut what the grid emits. Where the grid is already low-carbon, as in France or Sweden, the saving is small in absolute grams, because there is little to dodge: their 2025 hourly values ran from 13.6 to 87.4 g and from 11.6 to 57.6 g. In Germany, where hourly intensity swings far more widely, the saving can be sizeable, provided the workload can wait long enough. Which outcome you get depends on the carbon signal, the length of the shifting window, and whether work moves in time, in place or both.
Where a figure below is measured, the text says so. Where it comes from a simulation, it says that instead, because for European sites almost everything is simulated. The article ends with a checklist for an operator and a pointer to the ScienceShot live grid dashboard, where you can look at the daily spread yourself.
Two signals, two answers
A carbon-intensity signal says how many grams of CO2e one kWh of electricity carries in a given hour and place. There are two families, and they answer different questions. The average signal weights the whole generation mix by output. The marginal signal describes the “smaller set of fast-responding generators” that meet the last increment of demand, in the wording of Sukprasert et al. (E-Energy 2024).
According to Sukprasert et al., the GHG Protocol only requires reporting on the average signal, and marginal factors are hard to measure (Sukprasert et al., EuroSys 2024). Google’s system and the Wait-Awhile model both schedule on the average signal, so any claim that shifting “cut emissions” needs the signal and the accounting basis named.
The two signals disagree more often than intuition suggests. In the E-Energy study of 65 regions, 36 regions (55.4%) showed a negative correlation between the average and the marginal signal, and only 1.5% showed a strong positive one. For temporal shifting, scheduling and accounting on the average signal gave 18% savings, and on the marginal signal 11%. Judge either temporal schedule with the other signal and the savings turn negative, meaning emissions rose. For spatial shifting the other signal still showed savings, only smaller ones. The marginal series is a third-party estimate (WattTime), so this is a model result.
For Europe the closest analysis is Fleschutz et al. (Applied Energy, 2021; read as the preprint). They simulated daily 1 kWh load shifts for 20 European countries using 2017 to 2019 data and approximated hourly marginal factors from a merit-order model. Shifting to the cheapest hours raised marginal emissions in 8 of the 20 countries (including Germany and Spain) and by 2.1% on average across all 20. The mechanism is that lignite and coal can sit below gas in the merit order. The study is modelled and predates today’s carbon prices, so it describes a risk, not measured behaviour.
The honest summary is therefore narrow. Shifting lowers attributed emissions, which is what location-based reporting counts. Whether it lowers system emissions depends on the margin in that hour, and the sources we found do not measure that for a 1 to 50 MW European site.
How much grid there is to dodge: four countries in 2025
The table uses the 2025 statistics Electricity Maps publishes per country. They are flow-traced (imports count at the neighbours’ intensity) and are the vendor’s own computed figures, which we could not reproduce from raw data.
| Country (2025) | Annual mean, g CO2e/kWh | What else the source gives | Source |
|---|---|---|---|
| Germany | 335.4 | Hourly range 97.0 to 632.7 g. 1,843 hours (21.0% of the year, our calculation) were both below EUR 71/MWh and below 225 g. | Electricity Maps, Germany |
| Poland | 676.6 | Hourly range 318.2 to 941.4 g. | Electricity Maps, Poland |
| France | 32.0 | Hourly range 13.6 to 87.4 g. | Electricity Maps, France |
| Sweden | 21.3 | Hourly range 11.6 to 57.6 g. | Electricity Maps, Sweden |
Two readings follow, both our calculation from the table. First, the gap between countries dwarfs most gaps within a day: Germany’s annual mean is 10.5 times France’s, and Poland’s is 31.8 times Sweden’s. Second, the hourly range in Germany, 97.0 to 632.7 g, is 535.7 g wide over a year. A job that can only move a few hours cannot reach those extremes.
France and Sweden sit near the floor already. A kWh that moves from one hour to another within either country has little room to get cleaner, and Sukprasert et al. make the general point: more than 70% of the 123 regions they studied have low daily variation, and where variation is low the absolute emissions are often the highest. The same paper finds that the benefits of carbon-aware scheduling shrink as the supply gets greener.
A cross-border move works differently. On the annual means above, one kWh run in Sweden instead of Poland carries 655.3 g less (our calculation). That is the ideal case. Sukprasert et al. find that moving every job to Sweden with unlimited capacity would cut the global average by 352 g, a 96% reduction relative to the 368 g global average. With 50% mean utilisation the reduction is 51.5%, and with a 50 ms latency limit as well it is 31%. Residency, latency and spare capacity decide how much of the 655 g is reachable.
Window length: why a few hours can save almost nothing
Time shifting needs slack. The best-known European model, Wiesner et al., Middleware 2021, simulated nightly jobs on 2020 data with a 5% forecast error. In France the saving was 3.0% with a ±2 h window and 4.1% with ±8 h. In Great Britain it was 4.3% and 7.4%. Germany behaved differently: the saving was almost negligible up to ±4 h, rose steeply from ±5 h, and reached 11.2% at ±8 h.
Longer slack helps more. In the same model, German electricity was 25.9% cleaner at weekends than on workdays (243.7 against 328.7 g CO2e/kWh in 2020). Delaying a machine-learning training project to the next working day saved 2.5% to 6.3% across four regions for non-interruptible jobs, and up to 18.9% with semi-weekly deadlines and interruptible jobs. The model assumes no resource constraints, so these are ceilings.
Sukprasert et al. reach a similar conclusion on a larger sample: the ideal temporal saving can reach 189 g in some regions, but practical constraints cut it to 32 g on average, about 9% of the 368 g global mean (our calculation, 32 divided by 368.39). Long jobs use most resources and have the least slack.
Measured or modelled: what the evidence shows
Only one result below comes from a production system with a control group. The rest are simulations and depend on their inputs.
| Study | Measured or modelled | What it found | What it does not show |
|---|---|---|---|
| Google carbon-intelligent computing (Radovanovic et al.) | Measured: randomised daily assignment of clusters to shaped or unshaped, two months from February 2021 | Average cluster power at one campus fell by 1% to 2% in the highest-carbon hours. On one illustrative day, one cluster cut power by about 8% for six hours. | A tonnes-of-CO2e or percentage-emissions result. It reports power, not emissions. |
| Wiesner et al., Middleware 2021 | Modelled on 2020 data, average intensity | Nightly jobs: Germany almost nothing at ±4 h, 11.2% at ±8 h; France 4.1% and Great Britain 7.4% at ±8 h. | Resource limits at the data centre. Behaviour on today’s grid. |
| Sukprasert et al., EuroSys 2024 | Modelled on 123 regions, 2020 to 2022, average intensity | Realistic temporal saving about 32 g on average; ideal spatial up to 352 g, lower with utilisation and latency limits. | A Europe-only figure. We did not extract one and do not quote one. |
| Sukprasert et al., E-Energy 2024 | Modelled, 65 regions, third-party marginal estimate | 55.4% of regions had negative average-marginal correlation; for temporal shifting, savings turned negative when judged on the other signal (spatial savings stayed positive but smaller). | Observed marginal emissions. The marginal series is an estimate. |
| Fleschutz et al., 2021 | Modelled, 20 European countries, 2017 to 2019, approximated marginal factors | Price-based shifting raised marginal emissions in 8 of 20 countries, by 2.1% on average. | Present-day behaviour at current carbon prices. |
| Carbon Explorer (Meta) | Modelled, US sites, includes embodied carbon | Running 24/7 on carbon-free energy needed 19% to more than 100% extra server capacity, if all workloads were flexible. | European sites. Savings from shifting alone. |
The Google system forecasts day-ahead average carbon intensity from Electricity Maps, with forecast error between 0.4% and 26% depending on location and horizon. It flexes only low-priority batch work and is designed to keep the daily total of flexible compute constant.
Shifting also needs headroom, and extra servers carry embodied carbon. The Meta model finds that over-provisioned servers increase embodied carbon. The 19% to more than 100% extra capacity in that study belongs to a 24/7 carbon-free target at US sites, but the direction holds: capacity added in order to shift can eat part of the saving.
Get the next one by email
Power, cooling, chips and the rules that shape them. No spam, unsubscribe any time.
Which workloads can move
Interactive services cannot wait. Periodic batch work (nightly builds, backups, indexing, reports) and long-running work such as training and simulation can (Wiesner et al.). We found no source for the flexible share of load at European enterprise or colocation sites. Hyperscaler figures do not transfer (at Meta, offline data processing is about 7.5% of fleet workloads), and a colocation operator rarely controls its tenants’ schedules.
What EU reporting and EnEfG credit today
Under Commission Delegated Regulation (EU) 2024/1364, data centres with installed IT power demand of at least 500 kW report each year on the preceding calendar year. The Renewable Energy Factor is the sum of renewable energy claimed through retired Guarantees of Origin, power purchase agreements and on-site generation, divided by total annual energy consumption (Annex II point 1(o) to (r), Annex III(d)). Our reading of the full text is that it has no hourly or other sub-annual matching requirement and no requirement to report grid carbon intensity or emissions. Demand shifting appears only as a question about grid services.
The German Energy Efficiency Act is similar in wording. Section 11(5) EnEfG requires operators to cover their electricity consumption “bilanziell” (on a balance-sheet basis) with renewable electricity: 50% from 1 January 2024 and 100% from 1 January 2027. The paragraph names no hourly matching or matching period. We read only paragraph 5, so how the balance must be evidenced is outside what we verified.
The direction may change. The GHG Protocol consulted from 20 October 2025 to 31 January 2026 on a Scope 2 revision that proposes hourly matching of contractual instruments under the market-based method, except in cases of exemption, and finer time resolution for the location-based method. Its summary of feedback, published 29 July 2026, shows that of 909 responses to the hourly-matching question, 22% supported it and 70% gave low or no support, and that feedback now informs the next phase of the technical working group and review by the Independent Standards Board, so treat the outcome as unsettled. If an hourly requirement were adopted, time-of-day shifting would become visible in reported Scope 2, which the annual ratios cannot show today. Our regulation tracker and the article on 2025 PUE figures cover the wider reporting picture.
See the daily spread yourself
The ScienceShot live grid dashboard shows hourly carbon intensity and, where the source publishes them, day-ahead prices for 15 European markets, with the best 4-hour window for each. Its carbon figure is a production-based estimate: each fuel’s output multiplied by a lifecycle emission factor, divided by total output. Imports are excluded, and forecast hours are estimated from the renewable-share forecast. It is therefore not comparable with the flow-traced Electricity Maps figures above. Use it to see the shape of a day and how far the cheap hours line up with the clean ones, and use the sourced annual figures for any number you report.
Decision checklist for an operator
- Workloads. List the jobs with a deadline of hours or days: nightly builds, backups, indexing, reports, training. Record the slack for each, because a ±4 h window in Germany saves almost nothing in the Wiesner model and ±8 h saves about 11%.
- Place. If you already run in France or Sweden, expect few grams from timing alone: their 2025 hourly values never rose above 87.4 g and 57.6 g. If a workload can legally and technically run in a much cleaner country, the spatial gap is larger than any daily swing, subject to latency, residency and spare capacity.
- Signal. Choose one hourly average, location-based signal and keep it fixed so your results can be compared with your reporting. If you want to claim an effect on the grid, you need marginal evidence, and the E-Energy results show the two can disagree.
- Measurement. Meter hourly load at the workload level. Compare shifted and unshifted days, ideally by random assignment as Google did, and report energy shifted and the emissions change as separate numbers, on the same signal for both.
- Headroom. Count any capacity added to make shifting possible, including its embodied carbon, and the idle power of servers that now wait (Carbon Explorer).
- Reporting. Check what your reports credit. Under the EU regulation and EnEfG as written, hourly shifting changes nothing in the annual renewable ratios, so the benefit is internal or contractual, with no reporting gain.
Questions to put to a vendor of carbon-aware tooling:
- Which signal does the tool use (average or marginal, flow-traced or production-based), from which provider, and at what forecast error for my country and horizon?
- What published measurement shows emissions saved in production, as opposed to a simulation or a power shift? Ask for the method and the control group.
- What share of my load can it move, with which deadlines, and what does it do when forecasts are wrong?
- Does it report savings on the same accounting basis my reports use, and does it show a zero when the saving is zero?
- What extra capacity does it need, and who bears the embodied carbon?
The answers will often be modest. A saving of a few per cent on the right workloads in the right country is a real result, and the evidence supports no larger general claim.
Sources
- Electricity Maps, Grid in Review 2025: Germany
- Electricity Maps, Grid in Review 2025: France
- Electricity Maps, Grid in Review 2025: Sweden
- Electricity Maps, Grid in Review 2025: Poland
- Radovanovic et al., Carbon-Aware Computing for Datacenters (2021 preprint; IEEE Trans. Power Systems, 2023)
- Wiesner et al., Let’s Wait Awhile, Middleware 2021
- Sukprasert et al., On the Limitations of Carbon-Aware Temporal and Spatial Workload Shifting in the Cloud, EuroSys 2024
- Sukprasert et al., E-Energy 2024, DOI 10.1145/3632775.3661953
- Fleschutz et al., Applied Energy 295 (2021), preprint
- Meta, Carbon Explorer, ASPLOS 2023
- Commission Delegated Regulation (EU) 2024/1364, Article 3(1), Annexes II and III
- Energieeffizienzgesetz, section 11
- GHG Protocol, Scope 2 public consultation, October 2025
- GHG Protocol, Scope 2 public consultation: summary of feedback, 29 July 2026
- ScienceShot, live grid dashboard
Get the weekly brief
Sourced analysis of data-centre engineering and regulation, every Monday. No spam, unsubscribe any time.