Key takeaways
- Two failures hide behind one headline. A load can leave: about 1,500 MW of data-centre demand disconnected itself in Virginia on 10 July 2024 (NERC). A load can also shake the grid with a repeating power pattern. Measured swings are tens of MW. Hundreds of MW is a projection.
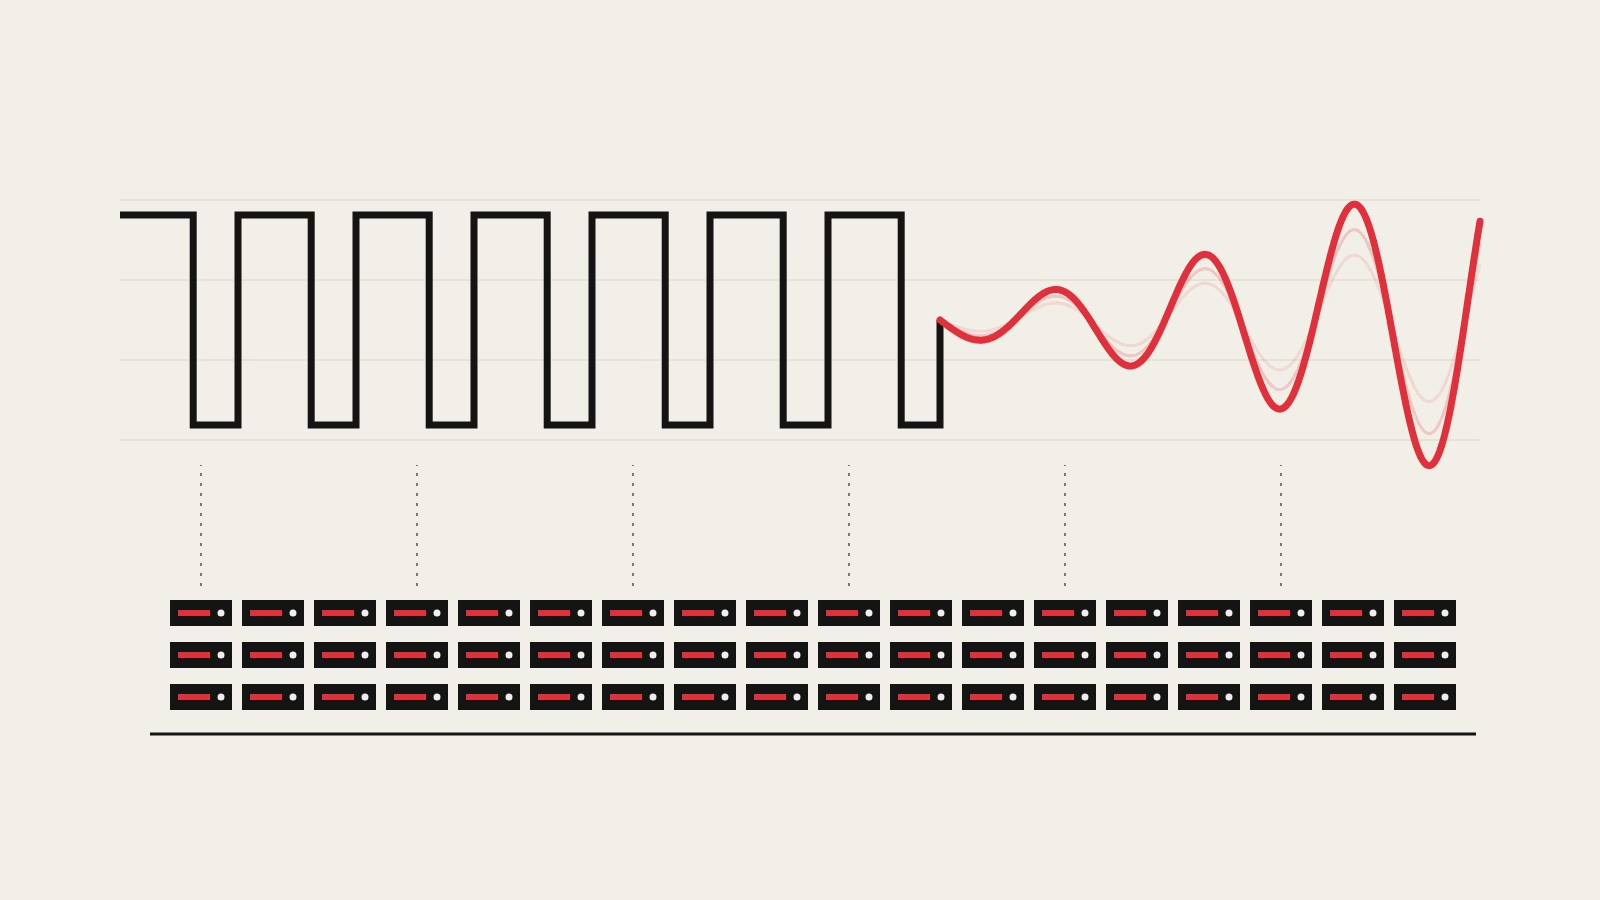
- Synchronous training makes thousands of GPUs change power together. In one measured job, Choukse et al. found the energy at 0.2 to 3 Hz. That overlaps grid modes below 1 Hz and from 1 to 2.5 Hz. Torsional shaft modes start at 7 Hz.
- In July 2024 automatic line reclosing interacted with a data-centre scheme that counted voltage disturbances. A scheme that counts voltage dips moved 1,260 MW to backup on the third dip, and the load stayed off for hours.
- The in-building fixes trade differently. A software power floor costs under 5% performance. A GPU power floor at 90% of rated power costs 10.5% extra energy in simulation. Rack storage holds energy rather than deliberately burning it, but is expensive at low frequencies.
- The status depends on the jurisdiction. ERCOT has effective requirements; Ireland has approved a change effective 27 October 2026. NERC requires alert responses but not implementation of its actions. NERC, EirGrid and SONI and ENTSO-E ask for ride-through, controlled recovery or ramp limits. Settle where smoothing and ride-through live before you sign.
About 1,500 MW of data-centre demand left the grid in northern Virginia during an 82-second run of faults on the evening of 10 July 2024. The all-island transmission peak across Ireland and Northern Ireland was 7,502 MW (EirGrid and SONI), so the loss equals about a fifth of that peak (our calculation). Nothing broke. NERC’s incident review found that customers’ own protection and controls disconnected the load.
A training run is a different kind of load from a web server. Its power use rises and falls together across thousands of chips, and a grid can respond to that rhythm. This article separates the two problems, compares the fixes and ends with a checklist. For current European grid data, see the ScienceShot live grid page.
Two failures, not one
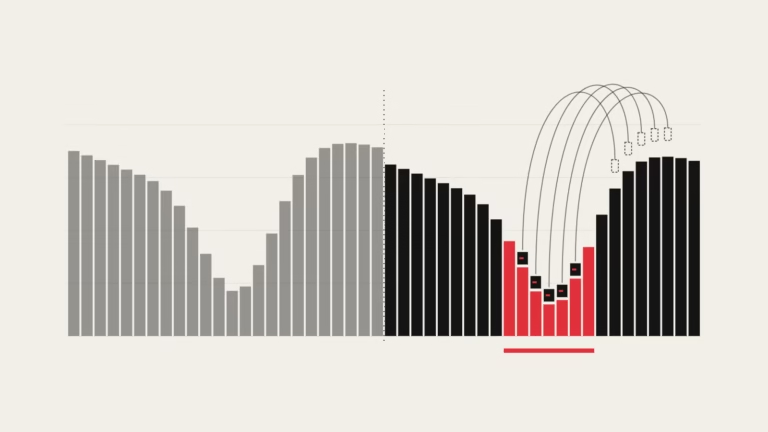
The first failure is a load that leaves. A voltage dip makes a site’s protection move it to backup power, and the grid loses the demand in one step. Frequency and voltage rise. The second failure is a load that shakes. A repeating power pattern pushes on the grid at a steady rhythm. If that rhythm matches a natural swing of the grid, the response can exceed the push.
The first failure is well documented. The second is less proven. ENTSO-E’s May 2026 report says such oscillations have already been observed in practice. The documented cases we could trace came from data-centre power electronics. In the sources reviewed here, we found no published large-grid event attributed specifically to synchronized AI training.
Why a training cluster swings in step
A large model is trained by splitting each step of work across many GPUs (graphics processors). In each step the GPUs first compute, then swap results in a step called all-reduce. Choukse et al. of Microsoft, OpenAI and NVIDIA describe the power effect in an arXiv preprint (Sections I and II-B). While computing, a GPU draws close to its thermal design power (TDP, its rated maximum). While communicating, it draws close to idle power. The job is synchronous, so all GPUs do this together.
The drops recur from once per second or less to once every tens of seconds, depending on job size (Section II-C). Meta saw the same with Llama 3. When tens of thousands of GPUs wait for a checkpoint (a saved copy of the model) or for communication to finish, power moves on the order of tens of megawatts across the data centre (Dubey et al., Section 3.3.4). Google reports fluctuations in the tens of megawatts at cluster level on similar workloads.
NERC holds the best measured trace. A high-speed recorder captured a 50 MW block of a 200 MW AI training data centre starting a run. In the fastest ramp, demand changed at 1.9 per unit per second for about 250 milliseconds (a per-unit value is a multiple of a reference load). Transitions between training and checkpointing took under one second (NERC white paper, July 2025, chapter 2). For an at-scale job on DGX-H100 racks, Choukse et al. found the spectrum energy between 0.2 and 3 Hz (Figure 3). The preprint also says swings at scale can reach hundreds of MW. That is a projection. Every measurement above stops at tens of MW.
Why a grid can hear a few hertz
A swing pushed at its natural rhythm rises far higher than the pushes alone explain. A power grid has natural rhythms too. NERC’s analysis of 11 January 2019 shows the effect with a non-AI source. A steam turbine in Florida had a control fault that cycled its valves every 4 seconds. That produced about 200 MW peak to peak at about 0.25 Hz for about 18 minutes. The Eastern Interconnection has its own mode near that frequency and amplified the signal, so swings of about 50 MW appeared in New England (NERC, Dec 2019).
Choukse et al. sort the risk into three bands (Section III-B). Below 1 Hz are inter-area modes, where regions of a grid swing against each other across long lines. From about 1 to 2.5 Hz are modes between closely coupled generating units. From 7 Hz to well above 100 Hz are torsional modes, where masses on one turbine shaft twist against each other. The training band of 0.2 to 3 Hz overlaps the first two and sits below the third.
Torsional risk is still real in principle. The preprint says a cyclical load that lines up with a shaft resonance risks fatigue or shaft failure (Section II-D). NERC’s white paper gives a size for a different load, an electric arc furnace: torque pulsations of about 30% peak to peak. We found no public report of shaft damage from an AI load, so treat this as a risk, not an incident.
The oscillations documented so far have another cause. The same NERC white paper describes a large Midwest data centre in 2023 whose power electronics perturbed the system once per second, a 1 Hz forced oscillation. A 2026 simulation study on test grids found that narrower fluctuation bands, larger single sites or dispersed siting can intensify oscillations, and that suppressing the load fluctuation at the source beats system-level measures. That is a model result, not a measurement.
How a UPS turns a 66 millisecond dip into hours of lost load
The Virginia event followed a chain NERC reconstructs in detail. A lightning arrestor failed on a 230 kV line and left a permanent fault. Automatic reclosing at each end retried the line, so the area saw six faults in 82 seconds. Each lasted 42 to 66 ms. Voltage in the area fell to 0.25 to 0.40 per unit, a quarter to two fifths of normal.
Most of the sustained loss, about 1,260 MW, arrived with the third dip. NERC names the cause as the interaction between the reclosing sequence and a protection scheme that counts voltage disturbances. In the scheme it describes, three disturbances within about one minute move the load to backup until someone reconnects it. The load stayed off for hours.
The UPS type decides how the load comes back. NERC describes central static UPS units of 2 to 5 MW, rack UPS units of 3 to 4 kW, and rotary UPS (DRUPS) with a flywheel and diesel engine. Load on static UPS returns quickly after a dip. Counting schemes and DRUPS, typically returned to the grid by hand, do not. For the batteries inside a UPS, see our comparison of lithium-ion and lead-acid.
On the grid, frequency peaked at 60.047 Hz and settled in about 4 minutes. Voltage rose to 1.07 per unit, and operators removed shunt capacitor banks to bring it down. NERC judged that neither was a reliability risk. It noted that grids are planned for losing generation, not for simultaneous load loss of this size. Every load on a circuit sees the same dip, so NERC flags a common-mode failure risk (Reliability Insights, September 2026).
| Date | Region | Data-centre load lost | Source |
|---|---|---|---|
| 10 Jul 2024 | Virginia | About 1,500 MW; 60.047 Hz | NERC incident review |
| 17 Feb 2025 | PJM | About 1,800 MW; about 60.042 Hz | PJM slides |
| 18 Apr 2026 | Same area as 2024 | 500 MW | NERC Reliability Insights |
| 6 Jun 2026 | Dublin | About 480 MW | CRU decision paper |
| 22 Jul 2026 | PJM | About 3,900 MW in two steps (2,900 MW, then 1,000 MW); 60.092 Hz; preliminary | PJM slides; NERC says nearly 4 GW |
The fixes show some effect. After 2024, certain data centres lengthened the time over which dips are counted and changed how many dips trigger a disconnection. In April 2026 a similar fault in the same area cost only 500 MW. NERC says the improvement may be attributable to those changes.
Get the next one by email
Power, cooling, chips and the rules that shape them. No spam, unsubscribe any time.
What grid operators now ask for
In the United States, NERC moved from a recommendation to an alert requiring acknowledgement and reporting in eight months. Its Level 2 recommendation of 9 September 2025 cites multiple events above 1,000 MW. Its Level 3 alert of 4 May 2026 sets seven essential actions. They include modelling data (ramp rate in MW per minute, UPS settings), studies of aggregate load loss, a commissioning test at plus and minus 10% voltage where possible, and corrective action so a normally cleared fault does not cause load loss. The alert does not make implementation of these actions mandatory, and non-implementation carries no penalty. Registered entities must acknowledge it and report. ERCOT’s NOGRR282 establishes voltage and frequency ride-through requirements. It was approved 9 July 2026 and took effect 1 August.
The European position paper is nonbinding. Ireland has approved a national change with a future effective date. ENTSO-E’s position paper of 11 December 2025 is non-binding and notes that EU connection codes cover data centres only when transmission-connected. For sites above 1 kV it proposes recovery to 80% to 100% of pre-disturbance power within 0.5 to 5 seconds, an allowed oscillation magnitude set by the grid operator in the 0.01 to 50 Hz range, and ramp limits (Annex A, A.2.6, A.2.7, A.2.9).
Ireland has approved a change, with its effective date still ahead. EirGrid and SONI’s MPID345 recommendation paper sets out the recovery target: transmission-connected demand must ride through faults and recover to 90% of pre-fault power within 500 milliseconds. The paper treats 900 MW of lost demand as the most the operator can manage. The CRU approved MPID345 and a modified compliance framework on 22 September. EirGrid records the effective date as 27 October 2026. It applies to current and future transmission-connected demand facilities. In Great Britain, NESO asked in November 2025 whether to codify large-demand requirements, and noted 125 GW of contracted demand in the queue. We found no final GB rule. On queue size, see phantom data-centre demand.
Three ways to flatten the swing
Choukse et al. compare three families in Section IV. The costs below are theirs unless stated.
| Family | How it works | Stated cost and limit | Source |
|---|---|---|---|
| Software power floor (“Firefly”) | Runs a secondary workload when GPU activity drops, up to 100% of TDP. Needs about 1 ms telemetry; 100 ms counters miss 20 Hz swings. | Under 5% performance overhead with NVIDIA MPS. Uses CPU cores and host-device bandwidth, wastes energy, needs customer cooperation, and ties the failure domains of both workloads. | Section IV-A |
| GPU power smoothing (GB200 and later) | Hardware sets ramp-up and ramp-down rates, a minimum power floor and a stop delay. | Floor at 90% of TDP: 10.5% energy overhead, simulated on the paper’s measured waveform. GB200 caps the floor at 90%, leaving at least 20% of TDP as dynamic range. A 10 MW range on a 100 MW job (10%) cannot be met by it alone. | Section IV-B |
| Rack-level and site storage | Capacitors or batteries absorb the swing and can lower peak draw by charging in low-power phases. | Stores energy rather than deliberately burning it. Low-frequency swings need very large capacitance: costly in money, rack space and embodied carbon. NVIDIA reports 30% lower peak demand in one GB200 rack test, and 65 J of storage per GPU in GB300. | Section IV-C; NVIDIA blog (vendor figures) |
NVIDIA’s number needs care. Sixty-five joules is the energy drawn by a 65 W load in one second (our arithmetic). That identity does not set a smoothing-duration limit. NVIDIA describes storage for fast transients; duration depends on the power difference it must buffer. NVIDIA says the storage returns no energy to the utility. Racks that move to 800 V DC power carry such power shelves.
Google reports that a compiler change cut TPU power fluctuation by nearly 50% (vendor blog, one test case). The preprint recommends a mix (Section IV-D). Use GPU smoothing for ramps and corner cases and rack storage for the rest, with site batteries at larger scale. A fast backstop watches site power in frequency bins and responds in tiers, from soft throttling to circuit-level shedding (Section IV-E).
What is still not known
The sources reviewed here did not identify a published large-grid event attributed specifically to synchronized AI training. The training-driven risk described here rests on models and specifications. The July 2026 numbers are preliminary. We did not read ERCOT’s rule text, so we give no ride-through curve. The preprint is not shown as peer reviewed, and the GB300 results are the vendor’s.
Decision checklist before you sign a connection
Decide where the smoothing and the ride-through live, and write both into the contract. Four questions settle it.
- What dynamic range and ramp rate will the utility allow? If the allowed band is under about 20% of TDP at the facility, plan on rack storage with a software floor as backstop, because GPU settings alone cannot meet it on GB200. A looser band may be met by GPU settings, at an energy cost (10.5% at a 90% floor in the simulation).
- Will the site ride through a dip, and how does it come back? Check how many dips in what window trigger a transfer (NERC found three in about one minute). Check whether return to the grid is manual or automatic, and whether load ramps back. Separate local requirements from recommendations: NOGRR282 is effective in Texas. Ireland’s approved MPID345 takes effect 27 October 2026; its recovery target is 90% within 500 ms. ENTSO-E’s paper is nonbinding and creates no national requirement by itself. NERC recommends commissioning tests at plus and minus 10% voltage where possible.
- Can the utility see you? Prepare dynamic model data, disturbance recording and an operations contact. Monitor the site feed by frequency, with a tiered response.
- What happens at the retrofit boundary? Specify power shelves or storage in new procurement, because adding rack storage later costs space and embodied carbon. Expect rules to reach existing halls: PJM notes that all observed events involved operating facilities, and Ireland’s approved compliance framework distinguishes facility groups and requires a compliance process. Check the final framework and your derogation conditions rather than assuming a blanket grace period.
The first test of these answers is already running. NERC’s Level 3 responses were due on 3 August 2026, and the July 2026 event is still being analysed. Grids were planned for losing a power station. They must now plan for losing a data-centre campus in one step.
Sources
- NERC, Incident Review, 8 January 2025
- NERC, Reliability Insights, September 2026
- NERC, Level 2 Recommendation, 9 September 2025
- NERC, Level 3 Alert, 4 May 2026 (NYSRC copy)
- NERC LLTF, Emerging Large Loads, July 2025
- NERC, Oscillation Event, 11 January 2019
- Choukse et al., arXiv:2508.14318
- Dubey et al., Llama 3, arXiv:2407.21783
- Ko and Zhu, arXiv:2508.16457
- NVIDIA, GB300 NVL72 power smoothing
- Google Cloud, Balance of power
- PJM, Large Computational Load review
- ERCOT, NOGRR282 status and rule record
- ENTSO-E, position paper, 11 December 2025
- ENTSO-E, Data centres and the power system
- EirGrid and SONI, MPID 345 paper
- CRU, MPID345 decision, 22 September 2026
- EirGrid, modification register and effective date
- NESO, Grid Code forum, 5 November 2025
- ScienceShot, live grid
Cite this article
Turner, A. (2026, October 14). Why one AI training run can make the power grid wobble. ScienceShot. https://scienceshot.com/post/ai-training-power-swings-grid-data-centres
Turner, Alex. “Why one AI training run can make the power grid wobble.” ScienceShot, 14 Oct. 2026, scienceshot.com/post/ai-training-power-swings-grid-data-centres.
Turner, Alex. “Why one AI training run can make the power grid wobble.” ScienceShot, October 14, 2026. https://scienceshot.com/post/ai-training-power-swings-grid-data-centres.
@online{scienceshot-ai-training-power-swings-2026,
  author       = {Turner, Alex},
  title        = {{Why one AI training run can make the power grid wobble}},
  organization = {ScienceShot},
  date         = {2026-10-14},
  year         = {2026},
  url          = {https://scienceshot.com/post/ai-training-power-swings-grid-data-centres}
}
https://scienceshot.com/post/ai-training-power-swings-grid-data-centres
Get the weekly brief
Sourced analysis of data-centre engineering and regulation, every Monday. No spam, unsubscribe any time.