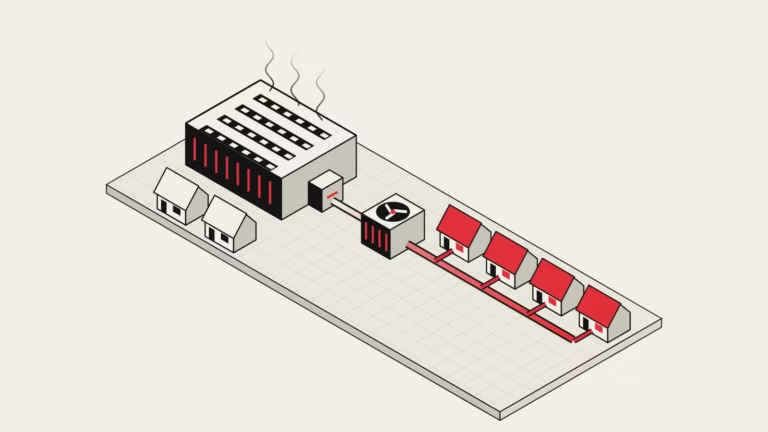
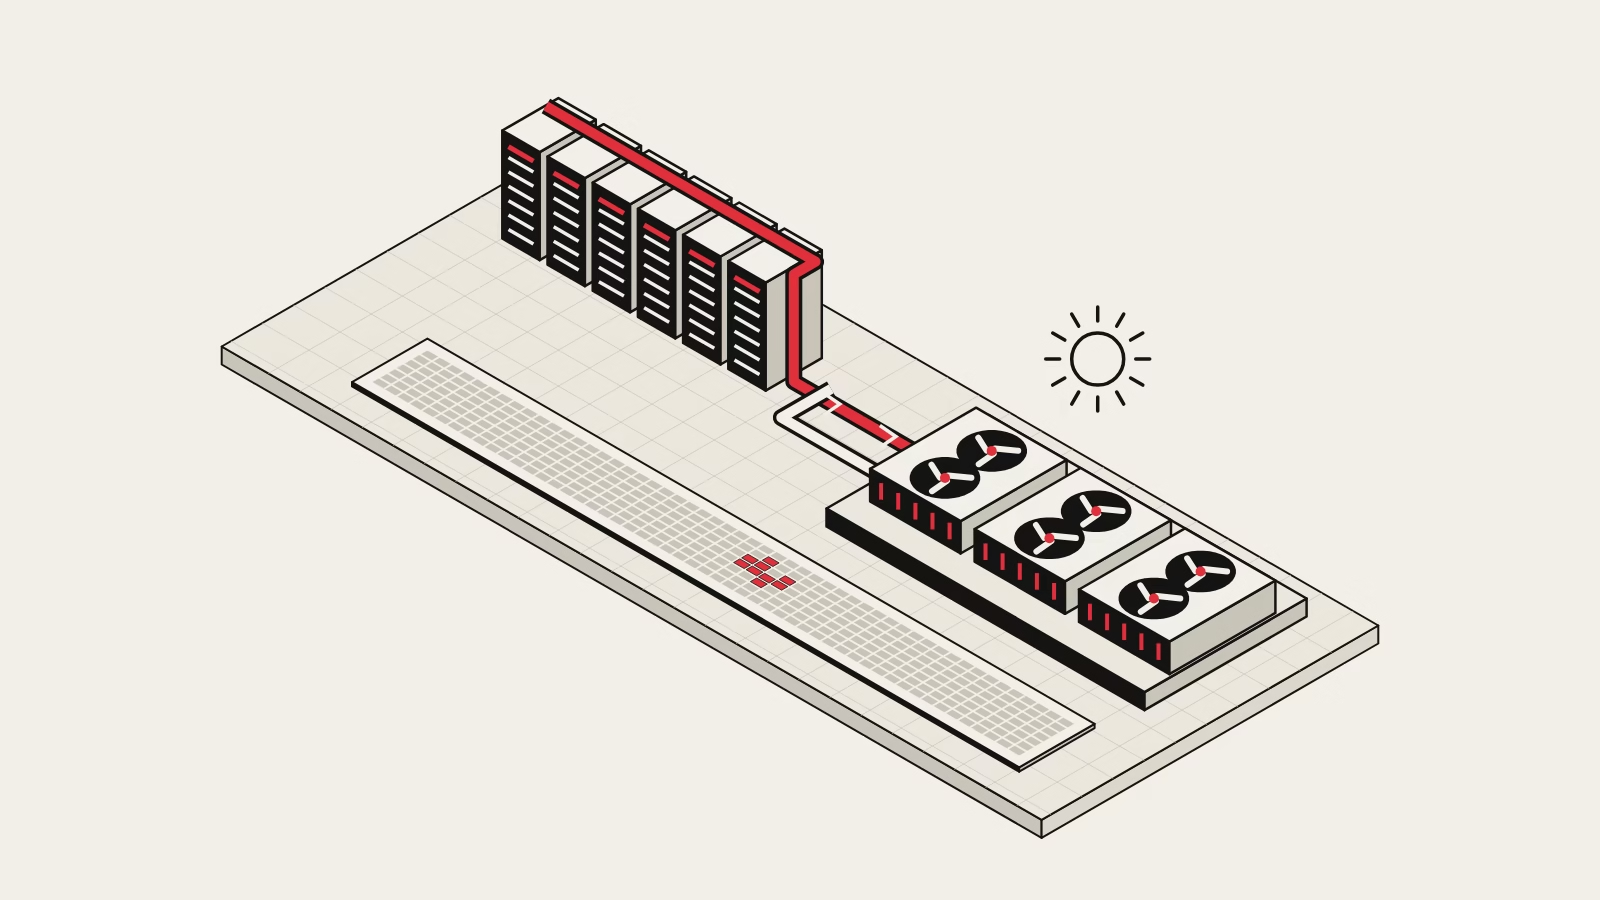
Key takeaways
- Nvidia’s “maybe 1% of the year” for chillers holds for Madrid and is generous elsewhere. At 45 °C coolant and a 9 K approach, Madrid was above the dry-cooling limit 97 hours a year (1.11%), Athens 42, Marseille 14. Paris, Frankfurt and Milan: 4.8 to 8.5.
- Seven of the 15 cities we can read never crossed the limit in ten years: Copenhagen, Dublin, Helsinki, Oslo, Stockholm, Warsaw and Zurich. Lisbon is shown but left out, because its grid cell reads too cool.
- Hours are not capacity. In Madrid’s hottest hour the outside air was 5.0 K above the limit, in Athens 6.8 K, and runs lasted up to 10 hours. A southern site still needs trim cooling sized for that peak.
- At 40 °C coolant, the level LiquidStack’s chief executive links to Blackwell, Madrid’s hours rise from 97 to 561 and Frankfurt’s from 7 to 75.
- The water saving is large but not yet rated. Nvidia’s figure of about 2.6 million US gallons per MW a year equals roughly 9,842 m3. In the Commission’s March 2026 draft annexes (the act sent to Parliament on 21 September may differ), class A water use is 0.1 L/kWh or less. The scheme is not in force.
Nvidia’s engineers say Rubin racks accept coolant up to 45 °C, and that chillers are needed “outside of maybe 1% of the year” in some climates (Nvidia blog post of 21 June 2026, quoting Ali Heydari). We tested that sentence against ten years of hourly weather in 16 European data-centre cities. In Madrid the answer is 1.11% of the year, which is 4.0 days. In seven cities it is zero.
| Figure | Value | Period | Source |
|---|---|---|---|
| Hours a year above the dry-cooling limit, 45 °C coolant, 9 K total approach | Madrid 97.1 h (1.11%), Athens 41.6 h, Marseille 13.9 h, Frankfurt 6.7 h; seven of 15 readable cities zero | 2016 to 2025, hourly, mean per year | ERA5 reanalysis (Copernicus C3S, via NCAR); ScienceShot analysis (scripts coolant_hours.py, coolant_results.py) |
What Nvidia claims and what it leaves out
The Nvidia blog post of 21 June 2026 says Nvidia’s newest servers run their cooling liquid at up to 45 °C. The liquid leaves the chips at roughly 55 °C. The loop is 75% water and 25% propylene glycol, a type of antifreeze. At CES in January 2026 Jensen Huang made the stronger statement that at 45 °C a data centre does not need a chiller (Facilities Dive report; we did not open the keynote itself).
The blog gives no climate, no approach temperature and no method for the 1%. It reads as a spoken estimate, and “some climates” is what a European operator needs to pin down.
One more caveat. Nvidia does not say whether 45 °C is the temperature at the rack or in the facility loop outside the heat exchanger. We read it as the supply to the rack, so the heat-exchanger penalty counts. The Nvidia post describes Rubin racks as 100% liquid-cooled and says previous liquid-cooled servers were hybrid, with the rest of the system still air-cooled.
How we tested it
A dry cooler is a large radiator with fans. It cools the coolant with outside air and no water. It can only bring the coolant down to a temperature above the air temperature, and that gap is the approach. The air temperature we use is dry-bulb, the ordinary thermometer reading. So the rule is simple. Dry cooling works while the outside air is at or below the coolant supply temperature minus the total approach.
Our central case has a total approach of 9 K (a difference of 1 K equals 1 °C). It is 4 K for the coolant distribution unit, the heat exchanger between the rack loop and the facility loop, plus 5 K for the dry cooler. The 4 K comes from Vertiv’s CoolChip liquid-to-liquid datasheet, which rates its liquid-to-liquid units from 121 kW to 2,300 kW at 4 K. The 5 K for the dry cooler is our assumption. We found no vendor figure we could verify. We also ran 6 K and 12 K. At 45 °C coolant and 9 K, the limit is 36 °C outside.
Where the heat goes
The weather comes from the ERA5 reanalysis, the Copernicus Climate Change Service’s hourly record, read through NCAR’s Research Data Archive: hourly air temperature for 16 cities, 1 January 2016 to 31 December 2025, with no missing hours. For each city we took one cell of the 0.25-degree grid, about 28 km from north to south: the nearest one that is at least half land in ERA5’s own land-sea mask. For each coolant temperature (30, 35, 40, 45 °C) and approach we counted the hours above the limit in each year, then took the mean over ten years. We also recorded the longest unbroken run, the worst year, and the largest excess over the limit in any hour. The excess is what a backup system must cover at peak. We found no earlier published city-by-city count to compare with.
Hours above the limit in 16 cities
The table shows mean hours a year above the limit with a 9 K approach. The limits are 21, 26, 31 and 36 °C outside for 30, 35, 40 and 45 °C coolant. Madrid is the only city above 1% of the year at 45 °C. Athens reaches 0.47%. The ranking changes at cooler settings: at 30 °C Athens (3,324.5 h) passes Madrid (2,400.7 h).
| City | 30 °C coolant, h/yr | 35 °C, h/yr | 40 °C, h/yr | 45 °C, h/yr | 45 °C as share of year |
|---|---|---|---|---|---|
| Madrid | 2,400.7 | 1,294.2 | 561.0 | 97.1 | 1.1% |
| Athens | 3,324.5 | 1,736.9 | 581.3 | 41.6 | 0.5% |
| Marseille | 2,343.6 | 1,022.5 | 265.3 | 13.9 | 0.2% |
| Milan | 2,338.0 | 979.1 | 231.7 | 8.5 | 0.1% |
| Frankfurt | 1,159.4 | 374.8 | 75.0 | 6.7 | 0.1% |
| Paris | 1,067.2 | 311.1 | 58.1 | 4.8 | 0.1% |
| Amsterdam | 581.2 | 109.1 | 12.1 | 0.5 | 0.0% |
| London | 493.0 | 90.0 | 6.8 | 0.4 | 0.0% |
| Warsaw | 1,071.6 | 303.9 | 29.6 | 0.0 | 0.0% |
| Zurich | 911.2 | 241.7 | 24.0 | 0.0 | 0.0% |
| Lisbon † | 1,177.3 | 122.0 | 3.5 | 0.0 | 0.0% |
| Oslo | 320.7 | 53.2 | 0.6 | 0.0 | 0.0% |
| Helsinki | 407.4 | 59.6 | 0.4 | 0.0 | 0.0% |
| Copenhagen | 409.0 | 55.1 | 0.0 | 0.0 | 0.0% |
| Stockholm | 349.3 | 25.8 | 0.0 | 0.0 | 0.0% |
| Dublin | 63.4 | 0.6 | 0.0 | 0.0 | 0.0% |
Your city, your settings
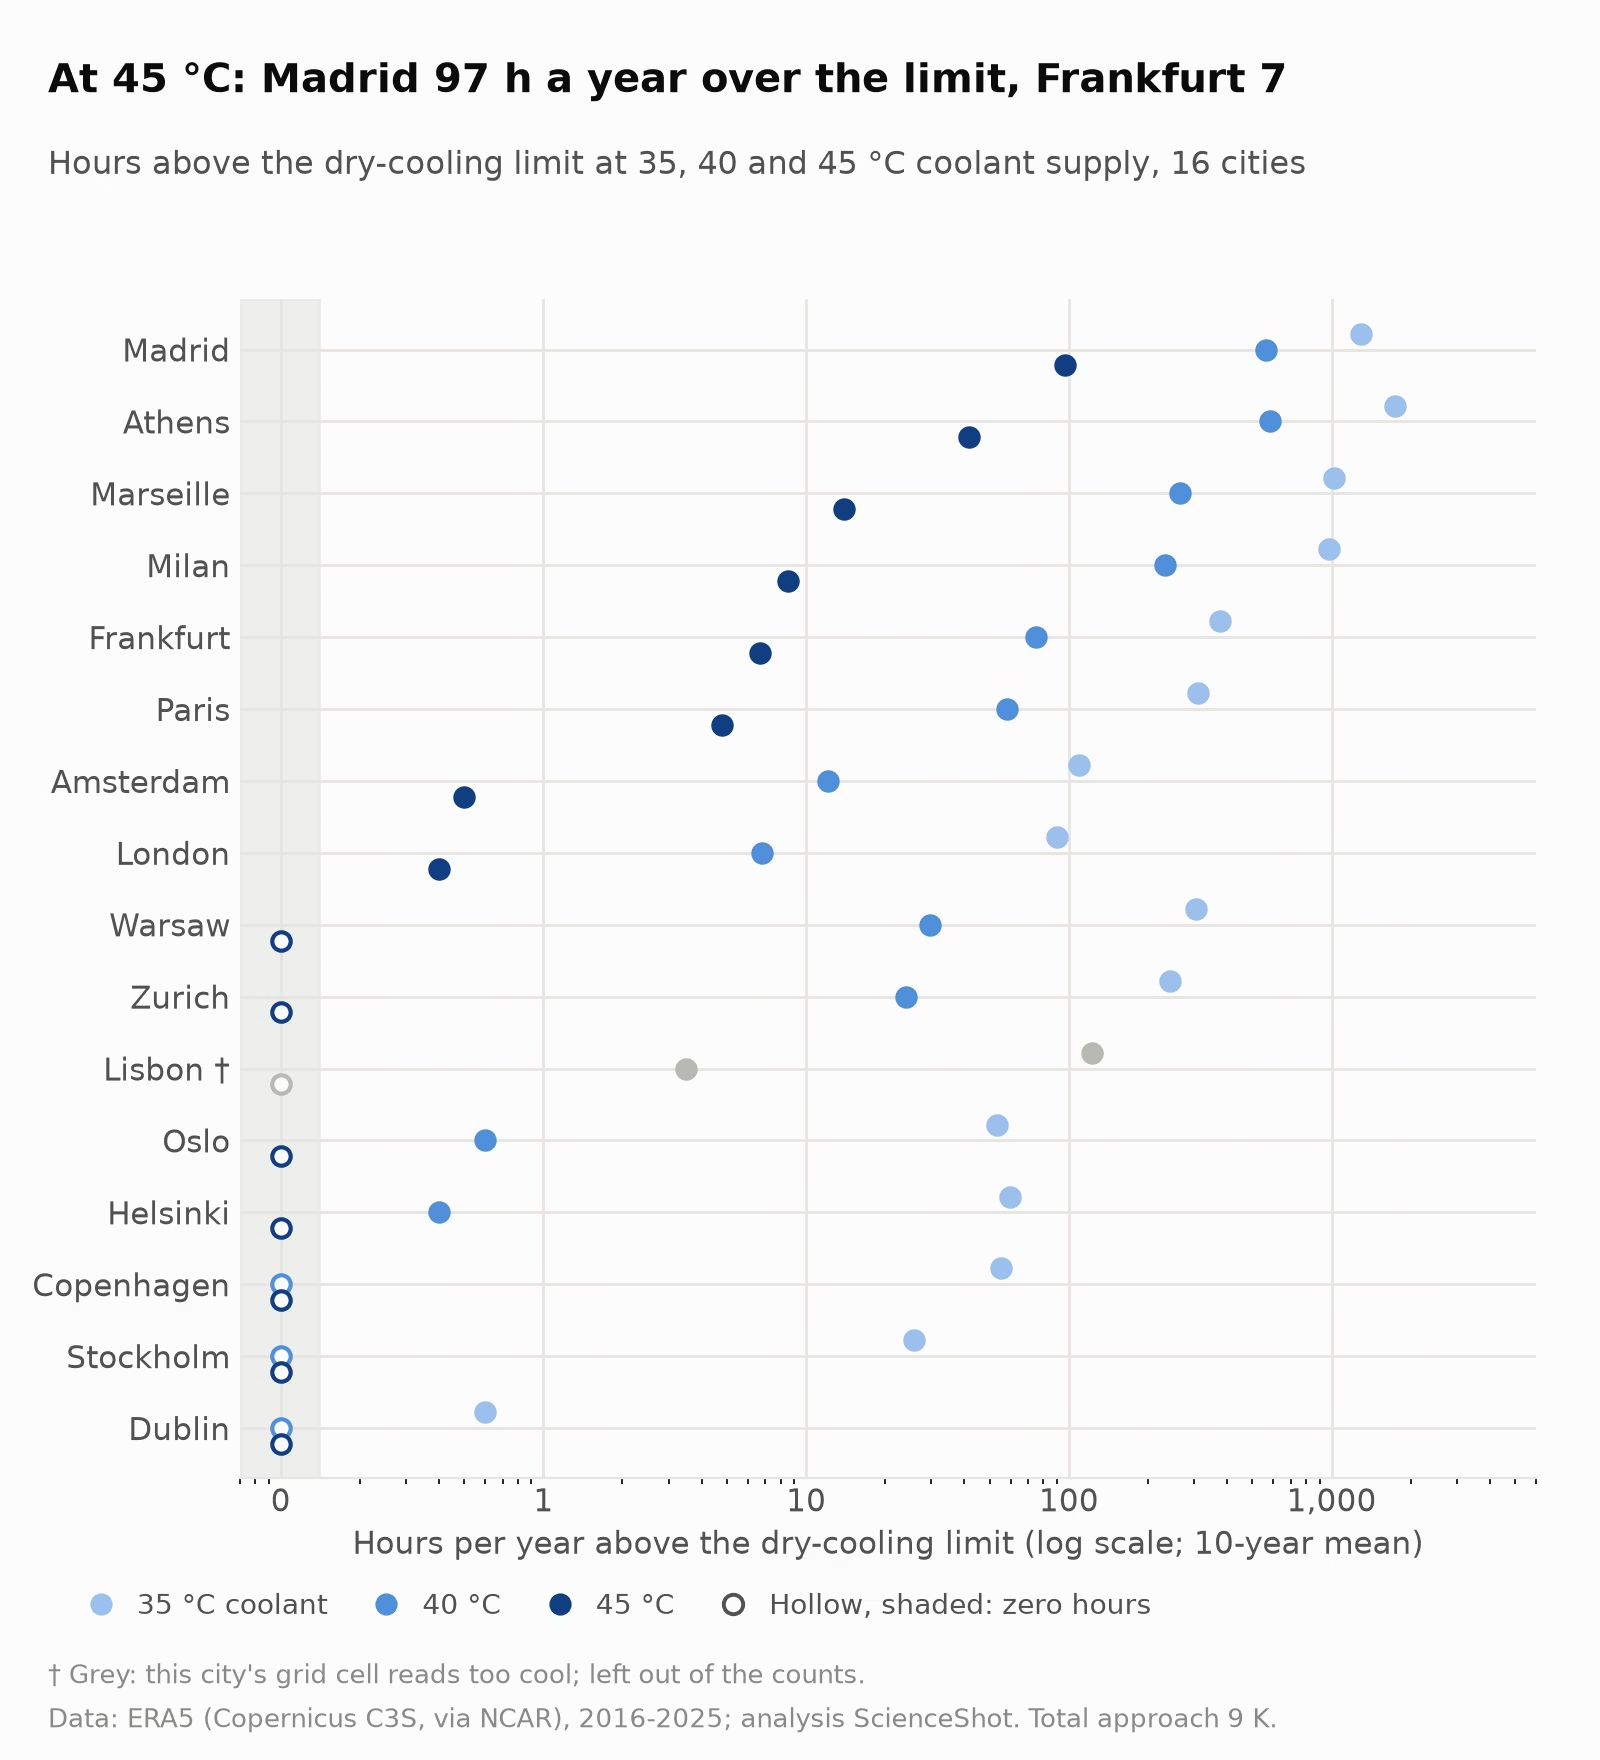
Madrid, 45 °C coolant, 9 K approach: the outside air rose above the 36 °C limit for 97.1 hours a year (1.11% of the year).
All 16 cities at these settings, hours a year above the limit (grey: left out of the conclusions, see the note)
Seven of the 15 cities we can read have no hour above 36 °C in ten years: Copenhagen, Dublin, Helsinki, Oslo, Stockholm, Warsaw and Zurich. Amsterdam and London had a mean of 0.5 and 0.4 hours. Paris, Frankfurt and Milan sit at 4.8, 6.7 and 8.5. Nvidia’s 1% is a fair description of the hottest hub and a generous one for the rest.
Year to year the count swings. Madrid’s worst year was 2017 with 133 hours (1.5% of that year), 1.4 times its mean. Athens peaked in 2021 with 100 hours. Among the eight cities with any hours, the worst year was 2017 for one, 2019 for three, 2021 for one, 2022 for one, 2023 for one and 2025 for one. None fell before 2017. Ten years is a short record.
Hours are not capacity
A count of hours says how often the dry cooler falls short. It does not say by how much. In Madrid’s hottest hour the outside air reached 41.0 °C, which is 5.0 K over the 36 °C limit. With nothing else switched on, the dry cooler would deliver coolant at about 50.0 °C instead of 45 °C. In Athens the peak was 42.8 °C, 6.8 K over the limit, or about 51.8 °C coolant. The longest unbroken run was 10 hours in Athens and 9 in Madrid.
So the question for a southern site is how large a backup to build, and of what kind. A chiller or a trim system in series with the dry cooler must be sized for the hottest hour, even if it runs 97 hours a year. Other routes are a tank of cold coolant that carries the rack through a short peak, or throttling. We found no published rule for how long a Rubin rack tolerates coolant above 45 °C. ASHRAE’s fifth edition of its thermal guidelines defines a liquid class as full, unthrottled operation across its range (Upsite summary; the standard itself is paywalled). Hours beyond the limit therefore mean either backup or lost performance.
Rare but sharp
At 45 °C coolant, Madrid has the most hours (97.1 a year) and Athens the largest excess (6.8 K above the 36 °C limit). 8 of the 15 cities we can read have any hours above the limit; seven have none.
At 40 °C coolant, Athens has the most hours (581.3 a year) and Athens the largest excess (11.8 K above the 31 °C limit). 12 of the 15 cities we can read have any hours above the limit; three have none.
Show the values behind the chart
| City | Mean h/yr | Largest excess, K | Longest run, h |
|---|---|---|---|
| Amsterdam | 0.5 | 2.0 | 4 |
| Athens | 41.6 | 6.8 | 10 |
| Frankfurt | 6.7 | 3.7 | 9 |
| London | 0.4 | 1.3 | 4 |
| Madrid | 97.1 | 5.0 | 9 |
| Marseille | 13.9 | 3.9 | 8 |
| Milan | 8.5 | 3.0 | 7 |
| Paris | 4.8 | 5.0 | 9 |
| Lisbon † | 0.0 | 0.0 | 0 |
| City | Mean h/yr | Largest excess, K | Longest run, h |
|---|---|---|---|
| Amsterdam | 12.1 | 7.0 | 10 |
| Athens | 581.3 | 11.8 | 22 |
| Frankfurt | 75.0 | 8.7 | 13 |
| Helsinki | 0.4 | 0.8 | 4 |
| Lisbon † | 3.5 | 3.7 | 10 |
| London | 6.8 | 6.3 | 10 |
| Madrid | 561.0 | 10.0 | 14 |
| Marseille | 265.3 | 8.9 | 12 |
| Milan | 231.7 | 8.0 | 13 |
| Oslo | 0.6 | 1.1 | 6 |
| Paris | 58.1 | 10.0 | 13 |
| Warsaw | 29.6 | 4.6 | 10 |
| Zurich | 24.0 | 3.7 | 7 |
† Lisbon's grid cell is 58% land, and its highest hour (34.7 °C) is several degrees below the inland land cells around it, which reached about 38 to 43 °C in July 2022 (ERA5, our check). Its zero hours are likely an underestimate, so Lisbon is left out of the counts and conclusions.
| City | Mean h/yr | Worst year, hours (year) | Longest run, h | Largest excess, K | Mean h/yr with +2 K stress |
|---|---|---|---|---|---|
| Madrid | 97.1 | 133 (2017) | 9 | 5.0 | 238.7 |
| Athens | 41.6 | 100 (2021) | 10 | 6.8 | 155.6 |
| Marseille | 13.9 | 43 (2025) | 8 | 3.9 | 60.2 |
| Milan | 8.5 | 31 (2023) | 7 | 3.0 | 49.1 |
| Frankfurt | 6.7 | 33 (2019) | 9 | 3.7 | 21.9 |
| Paris | 4.8 | 19 (2019) | 9 | 5.0 | 15.3 |
| Amsterdam | 0.5 | 5 (2019) | 4 | 2.0 | 3.2 |
| London | 0.4 | 4 (2022) | 4 | 1.3 | 1.6 |
| Warsaw | 0.0 | none | 0 | 0.0 | 3.6 |
| Zurich | 0.0 | none | 0 | 0.0 | 0.8 |
| Lisbon † | 0.0 | none | 0 | 0.0 | 0.3 |
| Oslo | 0.0 | none | 0 | 0.0 | 0.0 |
| Helsinki | 0.0 | none | 0 | 0.0 | 0.0 |
| Copenhagen | 0.0 | none | 0 | 0.0 | 0.0 |
| Stockholm | 0.0 | none | 0 | 0.0 | 0.0 |
| Dublin | 0.0 | none | 0 | 0.0 | 0.0 |
What each 5 K and each assumption does
The hours climb fast as coolant gets cooler. Going from 45 to 40 °C multiplies Madrid’s hours by 6, from 97.1 to 561.0 (6.4% of the year). Frankfurt’s rise by a factor of 11, from 6.7 to 75.0. Forty degrees is the supply level that LiquidStack’s chief executive Joe Capes put on Blackwell, in comments reproduced by Compass Datacenters.
The approach matters as much. With a tight 6 K approach, Madrid at 45 °C drops to 6.8 hours. With a loose 12 K approach it rises to 334.2 (3.8%), and Frankfurt goes from 6.7 to 35.6 hours. Our 5 K for the dry cooler is therefore the assumption to test with a vendor before anyone sizes a plant.
We also ran a stress test that adds 2 K to every hour. Gridded weather data average a city’s peaks away: the ERA5 maximum for Paris is 41.0 °C, while Météo-France’s daily bulletin for 25 July 2019 lists 42.6 °C at Paris-Montsouris. For London our maximum is 37.3 °C, while the Met Office extremes table lists 40.2 °C at Heathrow on 19 July 2022. A station and a grid cell are not the same thing, and gaps of 1.6 K and 2.9 K make 2 K a reasonable stress test. With it, Madrid rises to 238.7 hours (2.7%) and Athens to 155.6. Of the seven cities with zero hours, 5 stay at zero. Warsaw gains 3.6 and Zurich gains 0.8 hours.
Get the next one by email
Power, cooling, chips and the rules that shape them. No spam, unsubscribe any time.
What it saves in water, and how the rules would count it
The Nvidia post says its approach cuts facility water use from roughly 2.6 million US gallons per megawatt per year, for conventional cooling-tower systems, to near zero. That is about 9,842 m3, or 3.9 Olympic swimming pools (2,500 m3 each). If the megawatt is IT load running all year, it equals about 1.1 L per kWh. That last step is our assumption; Nvidia does not give the basis.
The EU measures this as water usage effectiveness (WUE): cubic metres of water per MWh of IT energy, which is the same as litres per kWh. It is defined in Annex III of Delegated Regulation (EU) 2024/1364, and sites of 500 kW IT load and above report it. The Commission’s draft rating scheme would grade it from A to G. It is a draft under Parliament scrutiny (procedure 2026/2895(DEA)) and is not in force. In the Commission’s March 2026 draft annexes (the act sent to Parliament on 21 September may differ), class A needs a WUE of 0.1 or less and a power usage effectiveness (PUE) of 1.15 or less. The draft text writes the water unit in a way that looks like a slip, so we read the thresholds as litres per kWh. Our rating-scheme explainer covers the grades. Spain’s draft royal decree, still a draft, would require class A from sites with 1 MW of grid access capacity or more, according to A&O Shearman. Our regulation tracker follows both.
A tower-cooled plant at about 1.1 L/kWh would exceed 1.0 L/kWh, the limit of class F in the draft, and so fall in its lowest class, G. A dry-cooled plant with chiller trim in Madrid uses little or no water, but its chillers draw electricity for about 97 hours. Adiabatic assist is a third route: a wetted pad cools the air before it reaches the coil. It trades those hours for water, and we did not model it.
Hotter return water, and what comes next
The coolant returns at roughly 55 °C. A heat network or a heat pump needs less lift from 55 °C than from the cooler return of an air-cooled hall, so the heat is easier to reuse. Whether anyone is nearby to take it is a separate question, which our heat-reuse explainer answers. For how the loops work, see our liquid-cooling article.
A next step beyond cold plates is cooling inside the silicon. Microsoft reported lab tests of microfluidic channels removing heat up to three times better than cold plates, and said the coolant would not need to be nearly as cold (Microsoft Source feature). It is a prototype, not a product.
Limits of the test
- The data are grid cells, not sites. A site on a hot roof, in a heat island or on a valley floor will differ, and the 2 K stress test is only a rough guide.
- We use one rule for every city: the nearest 0.25-degree cell that is at least half land in ERA5’s land-sea mask, so a coastal city is not read from open sea; that moved Marseille from its nearest cell, which was mostly sea.
- Lisbon’s grid cell is 58% land, and its highest hour (34.7 °C) is several degrees below the inland land cells around it, which reached about 38 to 43 °C in July 2022 (ERA5, our check). Its zero hours are likely an underestimate, so Lisbon is left out of the counts and conclusions.
- The record is the past. We make no forecast for the 2030s. The worst year fell in 2019 or later in seven of the eight cities with any hours, but ten years is too short to call a trend.
- The approach is an assumption. The 4 K figure is one vendor’s rating, and the 5 K dry-cooler figure is ours. The 6 K and 12 K runs show the range.
- We counted dry-bulb hours only. Humidity, part load and fan limits are not modelled. At part load a dry cooler delivers colder coolant, so our counts lean high for sites that rarely run at full power.
- Adiabatic assist is not in the headline figures. It would cut the hours above the limit at a water cost we did not measure.
What it changes for a European operator
In the seven cities with zero hours, a 45 °C design removes the chiller from the plan. Paris, Frankfurt and Milan are close, with a handful of hours and peak excesses of 5.0, 3.7 and 3.0 K, which a small trim system or a modest throttle could cover. In Madrid, Athens and Marseille the chiller shrinks to a trim unit but stays. Ask the vendor for the approach at your design flow, the allowed excursion above the rated coolant temperature, and the water use of any adiabatic stage.
The last open item is that excursion. We found no published figure for how many hours, and by how many degrees, a Rubin rack may exceed 45 °C without throttling. Until Nvidia or its partners publish one, a southern site has to size its trim for the hottest hour.
How to cite, method and data
Contains modified Copernicus Climate Change Service information [2026]. Hersbach et al. (2023), ERA5 hourly data on single levels from 1940 to present, Copernicus Climate Change Service (C3S) Climate Data Store, DOI 10.24381/cds.adbb2d47, accessed through the NCAR Research Data Archive (dataset d633000, DOI 10.5065/BH6N-5N20). Period: 1 January 2016 to 31 December 2025, 16 cities, hourly dry-bulb temperature at 2 m from ERA5 on a 0.25-degree grid (one cell per city: the nearest with a land-sea mask of at least 0.5). Limit = coolant supply minus total approach (9 K central; 6 K and 12 K sensitivity). Source label: ERA5 (Copernicus C3S, via NCAR), Copernicus licence, https://doi.org/10.24381/cds.adbb2d47. Method: ScienceShot coolant_era5_fetch.py, coolant_hours.py and coolant_results.py. The +2 K variant shifts every hour up by 2 K. Draft annexes: Ares(2026)3247482. Suggested citation: ScienceShot, “Is 45 °C coolant the end of chillers? A test in 16 cities”, October 2026.
Cite this article
Turner, A. (2026, October 22). Is 45 °C coolant the end of chillers? A test in 16 cities. ScienceShot. https://scienceshot.com/post/warm-water-cooling-45c-chiller-hours-europe
Turner, Alex. “Is 45 °C coolant the end of chillers? A test in 16 cities.” ScienceShot, 22 Oct. 2026, scienceshot.com/post/warm-water-cooling-45c-chiller-hours-europe.
Turner, Alex. “Is 45 °C coolant the end of chillers? A test in 16 cities.” ScienceShot, October 22, 2026. https://scienceshot.com/post/warm-water-cooling-45c-chiller-hours-europe.
@online{scienceshot-warm-water-cooling-45c-2026,
  author       = {Turner, Alex},
  title        = {{Is 45 °C coolant the end of chillers? A test in 16 cities}},
  organization = {ScienceShot},
  date         = {2026-10-22},
  year         = {2026},
  url          = {https://scienceshot.com/post/warm-water-cooling-45c-chiller-hours-europe}
}
https://scienceshot.com/post/warm-water-cooling-45c-chiller-hours-europe
Get the weekly brief
Sourced analysis of data-centre engineering and regulation, every Monday. No spam, unsubscribe any time.