Key takeaways
- One megawatt of load that moves 4 MWh a day from the dearest hours to the cheapest hours would have saved EUR 85k (NO2, southern Norway) to EUR 217k (Hungary) a year in day-ahead prices. The median across 15 zones was EUR 163k.
- The ranking follows the daily price spread. Hungary averaged EUR 177 per MWh between the dearest and cheapest hour, NO2 only EUR 69. Germany-Luxembourg (DE-LU) would have saved EUR 172k, or 18.9% of the flat bill.
- Value is seasonal. In DE-LU a 4 MWh daily shift was worth EUR 5,834 in February 2026 and EUR 16,228 in March. Midday solar is a likely reason, but we did not test it.
- Doubling the shift does not double the value. In DE-LU, 2 MWh a day saved EUR 98k, 4 MWh EUR 172k and 8 MWh EUR 261k.
- A battery with 85% round-trip efficiency keeps 93% of the DE-LU value but only 74% in IT-North. The number is energy-only: grid fees, taxes and the cost of the extra megawatt come on top.
A megawatt that can move 4 MWh of its daily consumption from the most expensive hours to the cheapest hours was worth between EUR 85,133 and EUR 216,988 a year in Europe’s day-ahead power markets, from October 2025 to September 2026. The low end is NO2 (southern Norway) and the high end is Hungary. A bidding zone is an area that shares one wholesale price, and we measured 15 of them. For a 10 MW site in DE-LU the same logic gives about EUR 1.7 million a year, before the costs listed below.
| Figure | Value | Period | Source |
|---|---|---|---|
| Day-ahead saving from moving 4 MWh a day, per MW of flexible load | EUR 85,133 (NO2) to EUR 216,988 (Hungary) per year; median of 15 zones EUR 162,867 | 1 Oct 2025 to 30 Sep 2026 | Bundesnetzagentur | SMARD.de, CC BY 4.0; ScienceShot analysis (method: ScienceShot flex_value.py) |
This article is about cost. Our earlier piece on carbon-aware computing asked when the grid is cleanest. Here the question is when it is cheapest, and the two are not always the same hour. Two 2026 publications look at the same idea from the grid side. Agora Energiewende and Deloitte estimated in their April 2026 study that flexible operation could cut data centres’ contribution to peak demand by up to 45% in 2035. ENTSO-E’s May 2026 report also names flexibility as a role for data centres. Neither puts a price on one megawatt, zone by zone. This analysis does.
What we measured
We took hourly day-ahead prices for 15 zones from Bundesnetzagentur | SMARD.de. Day-ahead prices are fixed in an auction the day before delivery, so a schedule built on them needs no forecast. Each zone has 365 complete local days. Daylight-saving days have 23 or 25 hours, and we kept them.
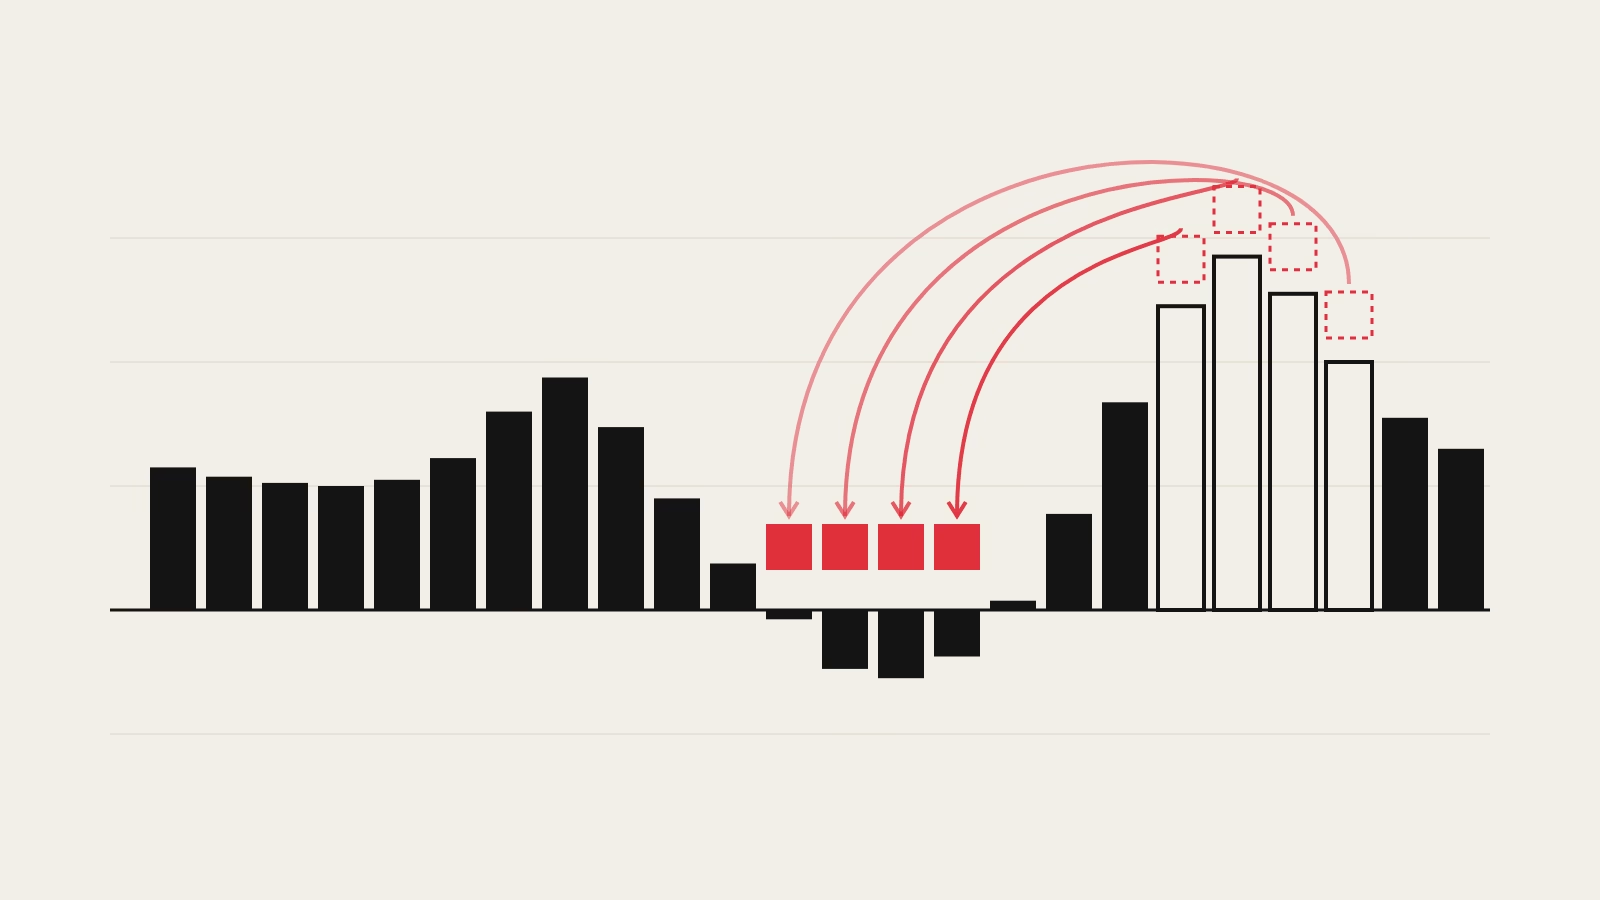
The baseline is a flat 1 MW load. It buys 1 MWh in every hour at the day-ahead price. The flexible load buys the same energy each day. It moves k MWh out of that day’s k most expensive hours and into that day’s k cheapest hours, with k set to 2, 4 and 8. The saving on a day is the sum of the k highest prices minus the sum of the k lowest. Because the energy is unchanged, the saving is purely a price effect.
The catch is capacity. Moving 4 MWh into the 4 cheapest hours means running at 2 MW in those hours, so the site needs twice its average capacity. If a data centre has no spare capacity, the flexibility has to come from a battery or from workloads that can be paused, such as batch jobs or AI training.
The result for all 15 zones
The table is sorted by the 4 MWh saving. Hungary leads at EUR 217k a year (19.5% of its flat bill). NO2 is last at EUR 85k (10.0%). The largest share of the bill belongs to FR at 21.7%, helped by a low price level: its flat bill is the smallest of the 15 at EUR 670k.
| Zone | Flat 1 MW bill, EUR per year | 2 MWh a day, EUR per year | 4 MWh a day, EUR per year | 8 MWh a day, EUR per year | 4 MWh as share of bill | EUR per MWh moved (4 MWh) | Negative-price hours |
|---|---|---|---|---|---|---|---|
| HU | 1,113k | 123k | 217k | 328k | 19.5% | 149 | 233 |
| PL | 1,026k | 108k | 187k | 278k | 18.2% | 128 | 313 |
| SI | 1,061k | 101k | 178k | 272k | 16.8% | 122 | 233 |
| DE-LU | 911k | 98k | 172k | 261k | 18.9% | 118 | 508 |
| CZ | 985k | 97k | 170k | 260k | 17.3% | 117 | 279 |
| NL | 903k | 96k | 169k | 255k | 18.7% | 115 | 429 |
| AT | 1,048k | 92k | 164k | 252k | 15.6% | 112 | 252 |
| DK2 | 903k | 93k | 163k | 249k | 18.0% | 112 | 106 |
| BE | 884k | 88k | 156k | 238k | 17.7% | 107 | 323 |
| DK1 | 886k | 89k | 156k | 238k | 17.6% | 107 | 223 |
| FR | 670k | 81k | 145k | 227k | 21.7% | 100 | 529 |
| SE4 | 721k | 77k | 138k | 215k | 19.1% | 94 | 145 |
| CH | 1,043k | 67k | 121k | 185k | 11.6% | 83 | 239 |
| IT-North | 1,210k | 56k | 100k | 152k | 8.3% | 69 | 0 |
| NO2 | 856k | 48k | 85k | 132k | 10.0% | 58 | 62 |
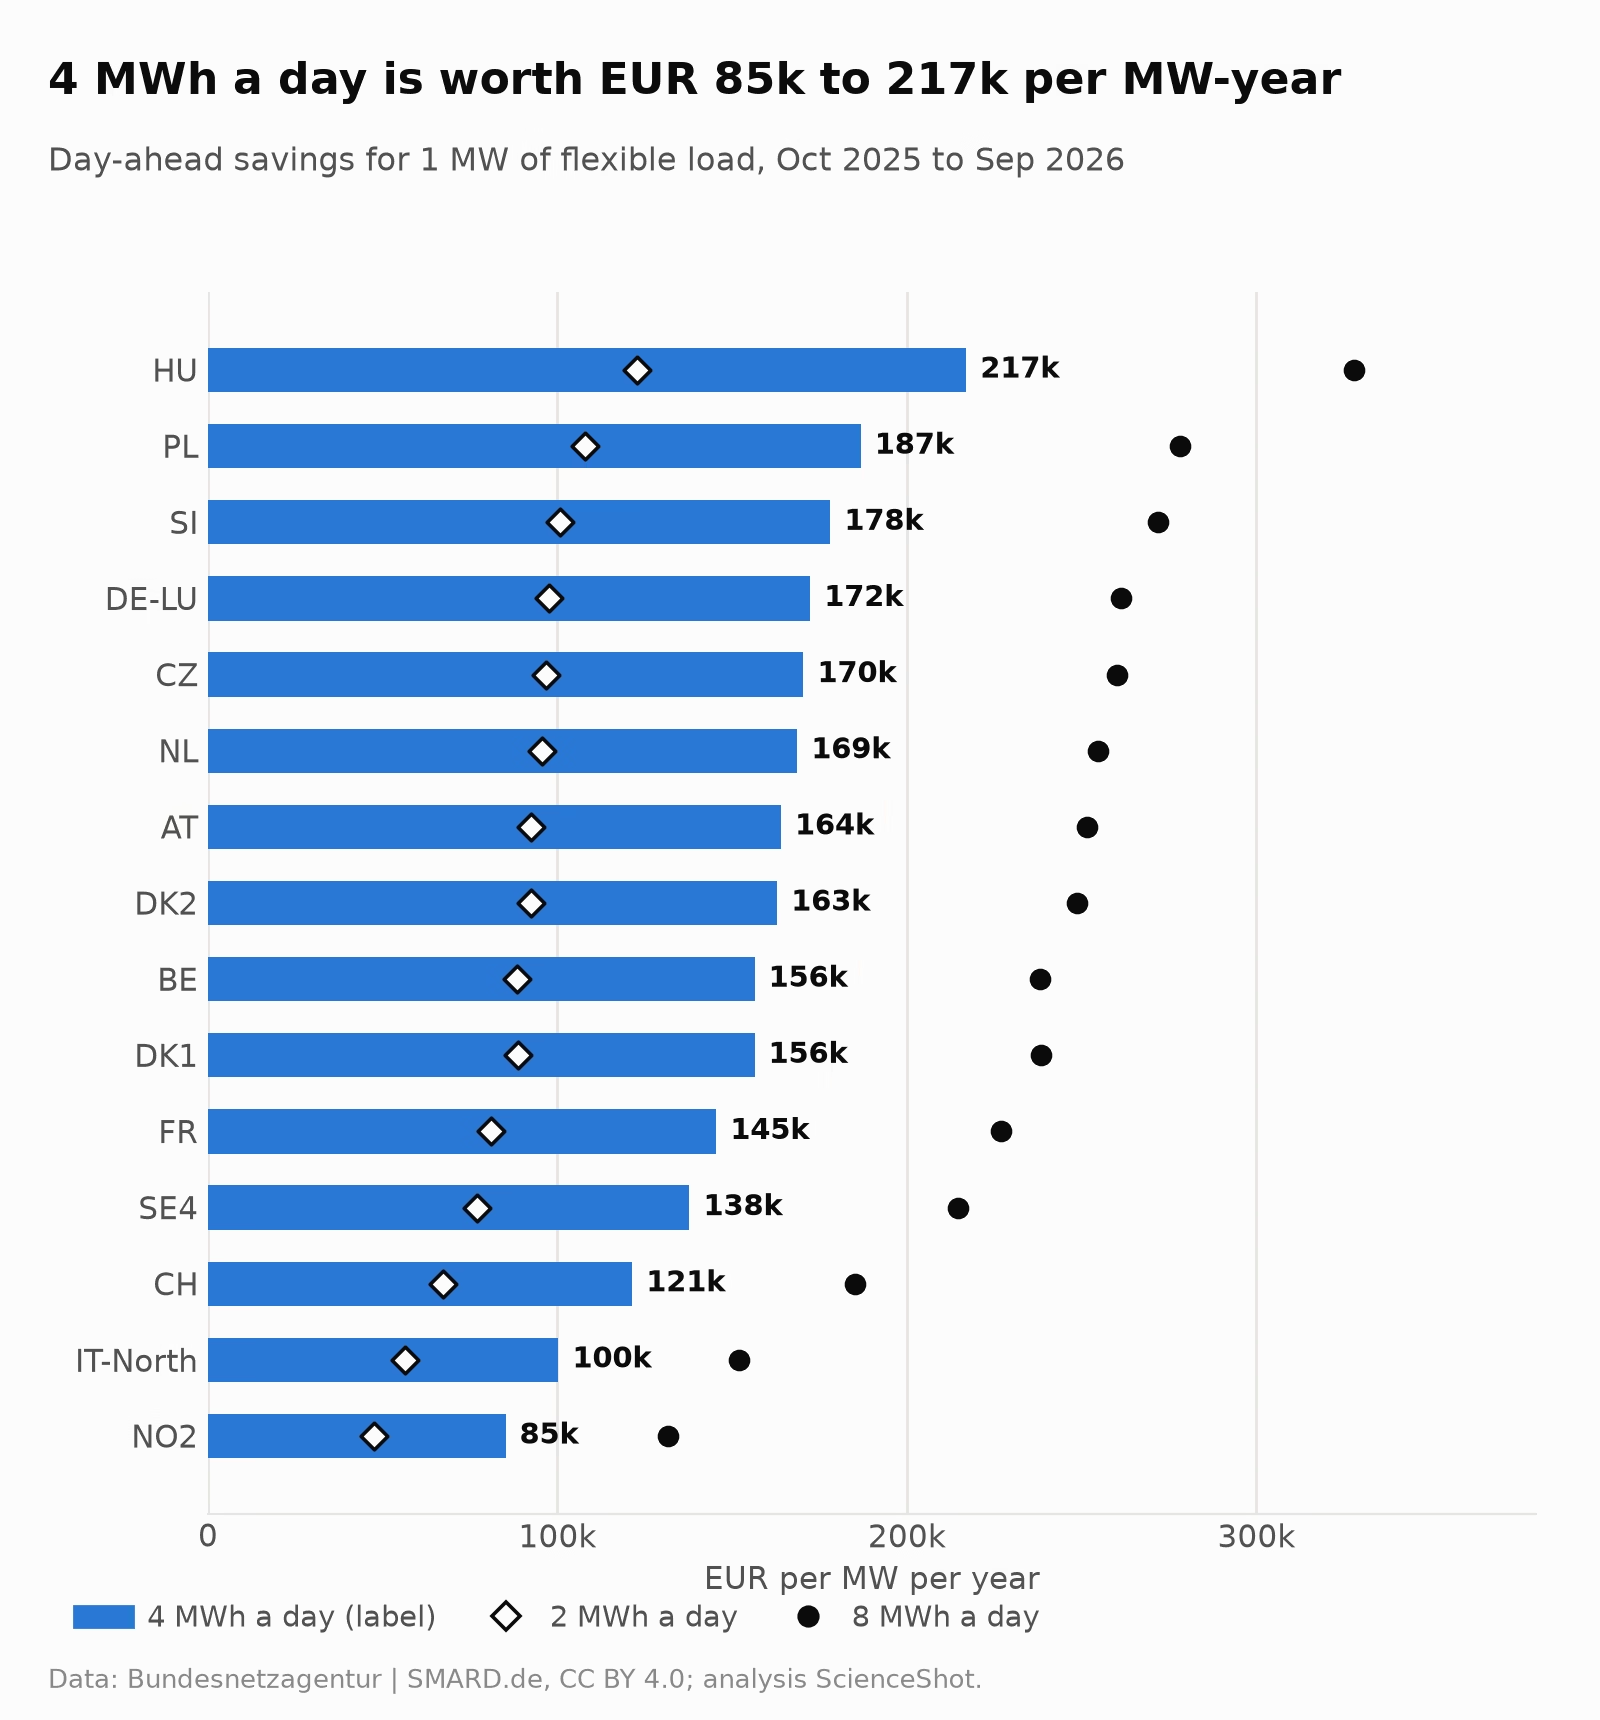
Each extra MWh moved earns less than the one before, because it uses a less extreme hour. In DE-LU the 2 MWh case earned EUR 134 per MWh moved, the 4 MWh case EUR 118 and the 8 MWh case EUR 89. The first hours of flexibility are worth the most.
Get the next one by email
Power, cooling, chips and the rules that shape them. No spam, unsubscribe any time.
Why the ranking looks like this
The saving is the gap between a day’s dearest and cheapest hours, so it follows the daily spread. HU averaged EUR 177 per MWh. DE-LU averaged EUR 140. IT-North averaged EUR 81 and NO2 EUR 69.
The saving rises sharply in spring. In DE-LU the 4 MWh saving was EUR 5,834 in February and EUR 16,228 in March. A likely explanation, which we did not test, is that from spring midday solar output pushes prices down while evenings stay expensive. DE-LU had 508 hours with a negative price, which means producers paid to deliver power. France had 529, the most of any zone, and the Netherlands 429.
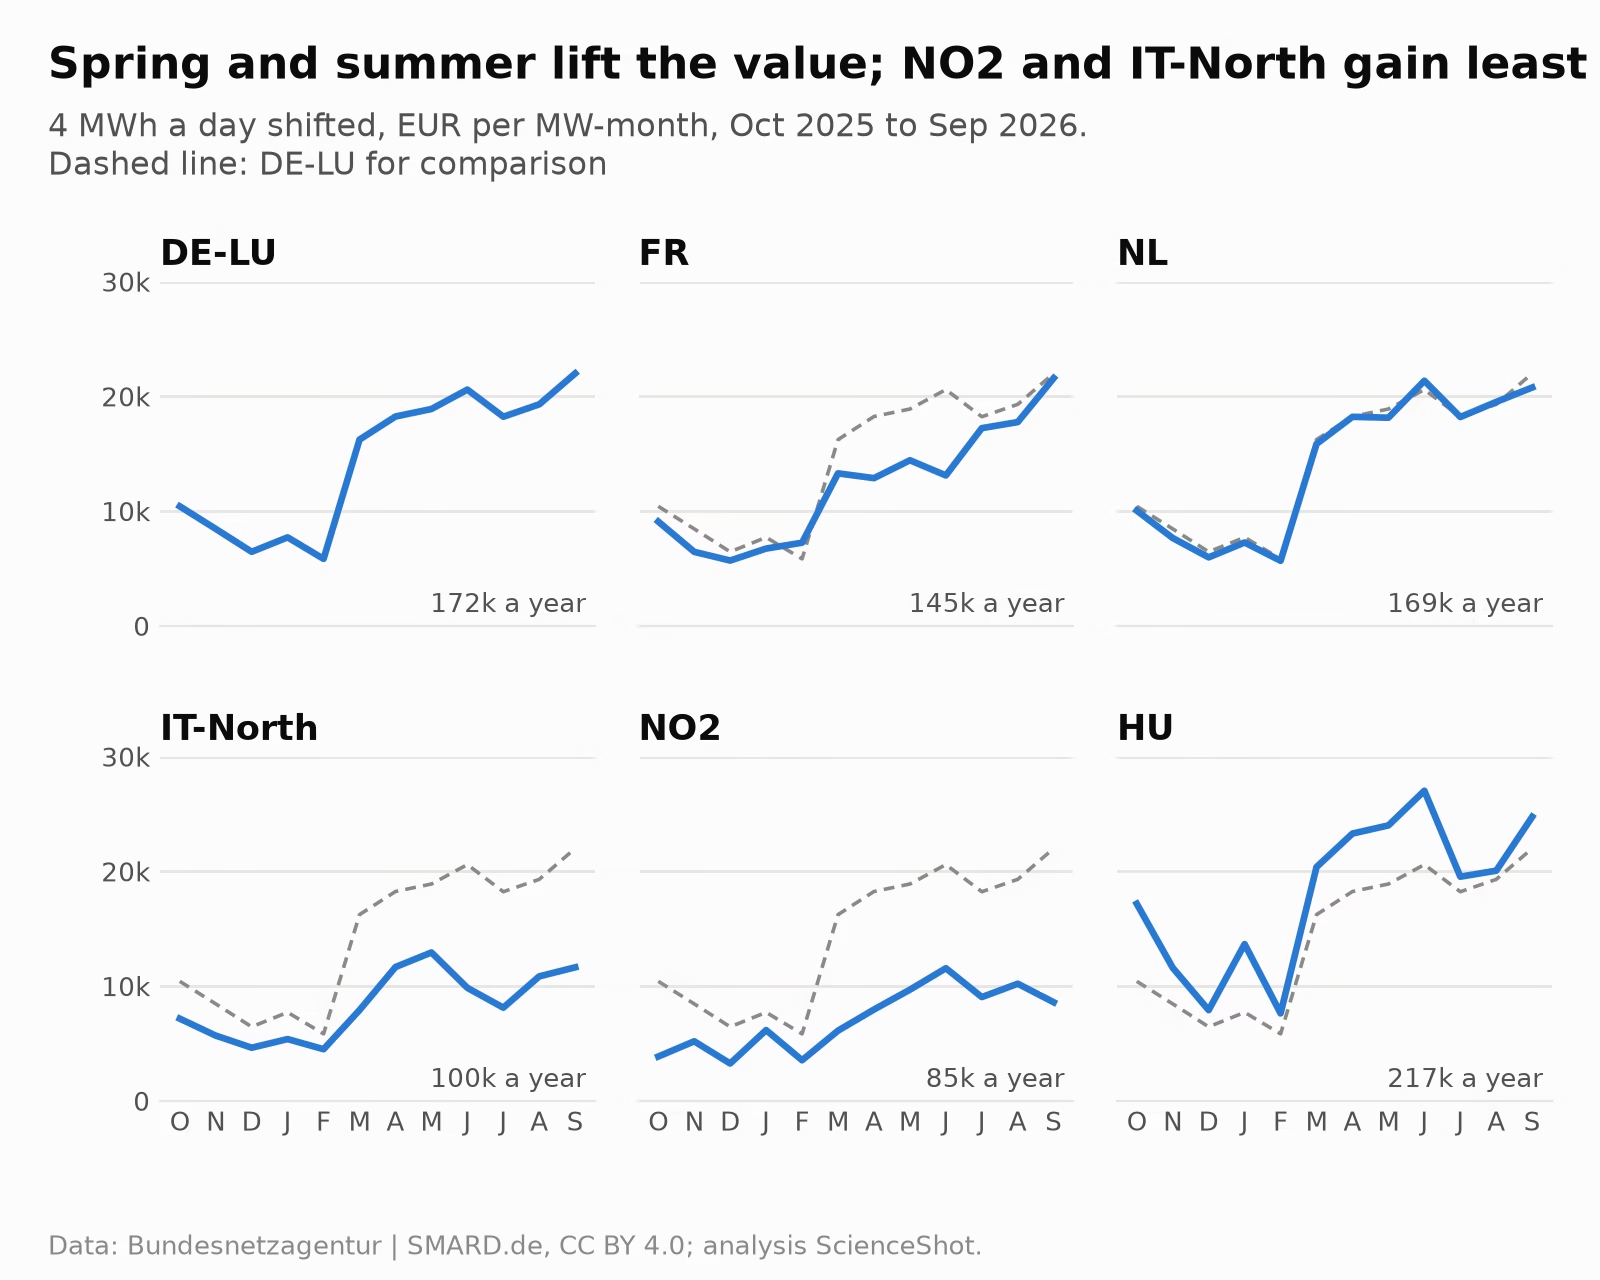
The low end looks different. IT-North recorded 0 negative hours in our data, and its lowest hourly price was EUR 0 per MWh. NO2 and IT-North had the smallest daily spreads. We did not test why. Possible explanations, none tested here, are reservoir hydro, which can hold back water for expensive hours, and strong links to neighbouring zones. Switzerland, which has a large hydro fleet, ranks 13th of 15 at EUR 121k, which would fit the same pattern.
What this number is not
Read the figure as the energy-only, day-ahead value of a perfectly executed schedule, before costs. A business case needs more.
- Energy only. It excludes network tariffs, taxes and levies. In many countries grid charges do not follow the hourly price, so they can erase part of the saving or add to it.
- Day-ahead only. Capacity payments, balancing markets and the intraday market are not modelled. We also assume the site buys all its energy at the day-ahead price. A site on a fixed-price contract sees none of this saving unless the contract passes prices through.
- Known prices, real delivery. Day-ahead prices are published the day before, so choosing the hours is realistic. Delivering the schedule exactly is not guaranteed, and any deviation is settled at imbalance prices that we did not model.
- The extra megawatt costs money. A 4 MWh shift needs 2 MW of capacity in the cheap hours. Transformers, switchgear and cooling for the second megawatt are not in the saving.
- One year only. The gas price, the solar fleet and battery build-out all change the spread.
- Service levels and heat. A workload with a deadline, or a room that cannot ride out a cooling pause, cannot move freely.
A battery loses energy in each cycle. Suppose it returns 85% of what it stores. To deliver 4 MWh in an expensive hour it must charge 4 / 0.85 = 4.71 MWh in cheap hours. We skipped days when the spread did not cover the loss. A daily 4 MWh cycle then earned EUR 161k in DE-LU instead of EUR 172k, a loss of 6.6%. The loss was 6.6% in HU, 19.8% in NO2 and 26.3% in IT-North. Zones with a narrow spread lose more, because the losses take a larger share of a small gap. Battery wear and purchase price are not included.
The market also moved to 15-minute products on 1 October 2025. Our main numbers use hourly averages. We re-ran the 4 MWh case on native quarter-hour prices for 14 zones, and the saving rose by 2.9% (NO2) to 7.0% (AT). The Swiss series showed no quarter-hour variation, so it is unchanged. The hourly table is therefore a slightly conservative estimate for a load that can be scheduled at 15-minute precision.
What a CTO or COO does with it
Use the table to decide whether flexibility deserves an engineering study. Then check these points before spending money.
- Which workloads can move? Training checkpoints, batch analytics and backups can. Customer-facing services with a latency target cannot.
- How much spare capacity exists? The 4 MWh case needs 2 MW per MW of average load in the cheap hours. With less headroom, a smaller shift is the realistic option.
- Is a battery better than load shifting? Load shifting loses no energy. A battery gives up 7% of the DE-LU value but needs no change to the workloads.
- Does your contract pass day-ahead prices through? If not, ask your supplier for an index-linked tariff.
- What do network charges do? Ask your grid operator whether charges vary by time of day and whether a flexible connection is offered.
- Where to build? A wide spread pays more for flexibility, but a flat load also costs more there: Hungary’s flat bill was EUR 1,113k per MW, against EUR 856k in NO2.
How to cite, method and data
Data: Bundesnetzagentur | SMARD.de, CC BY 4.0, smard.de/en/datennutzung; analysis ScienceShot. Period: 1 October 2025 to 30 September 2026, 365 complete local days per zone, hourly day-ahead prices. Method: ScienceShot flex_value.py. Battery case: 85% round-trip efficiency, days skipped when the spread does not cover losses. Quarter-hour check: native 15-minute prices for 14 zones. Suggested citation: ScienceShot, “What one megawatt of flexible load is worth in 15 European power markets”, October 2026.
Cite this article
Turner, A. (2026, October 20). What one megawatt of flexible load is worth in 15 European power markets. ScienceShot. https://scienceshot.com/post/flexible-megawatt-value-europe-day-ahead-prices
Turner, Alex. “What one megawatt of flexible load is worth in 15 European power markets.” ScienceShot, 20 Oct. 2026, scienceshot.com/post/flexible-megawatt-value-europe-day-ahead-prices.
Turner, Alex. “What one megawatt of flexible load is worth in 15 European power markets.” ScienceShot, October 20, 2026. https://scienceshot.com/post/flexible-megawatt-value-europe-day-ahead-prices.
@online{scienceshot-flexible-megawatt-value-europe-2026,
  author       = {Turner, Alex},
  title        = {{What one megawatt of flexible load is worth in 15 European power markets}},
  organization = {ScienceShot},
  date         = {2026-10-20},
  year         = {2026},
  url          = {https://scienceshot.com/post/flexible-megawatt-value-europe-day-ahead-prices}
}
https://scienceshot.com/post/flexible-megawatt-value-europe-day-ahead-prices
Get the weekly brief
Sourced analysis of data-centre engineering and regulation, every Monday. No spam, unsubscribe any time.