Key takeaways
- At the 2025 industry average PUE of 1.54, 35% of the energy a site buys is not IT energy (Uptime Institute). Reaching 1.3 removes 44% of that overhead*.
- Cooling and fans were the largest share of overhead at the four audited sites we opened, so cooling measures lead the list (NOAA, three federal sites).
- Airflow repair comes first because the EU guidance calls it the enabler: set points and airflow can change only after it is done (JRC, 2025).
- A lower PUE can hide a saving that did not happen. In a peer-reviewed worked example, efficient servers lift PUE from 1.6 to 1.74 while site power falls 12%* (Patterson et al., 2013).
- No source we opened compares a retrofit with a CRAC replacement at the same site. The table states how each result was obtained.
The first decision is order. For an older room, the third-party evidence points to airflow repair first, then higher supply temperatures, then the cooling plant, then the UPS (uninterruptible power supply, the battery system that covers a power cut). A US government laboratory forecast in 2014 that this package would move three federal sites from PUE 1.80, 2.07 and 1.78 to 1.45, 1.55 and 1.38 (Lawrence Berkeley National Laboratory, May 2014). Those are forecasts.
The only whole-site fall we found is a reported bundled rebuild, from more than 2 to 1.27 after a USD 8.3 million project (US Department of Energy, 2018). German law sets 1.5 from 1 July 2027 and 1.3 from 1 July 2030 for existing sites of 300 kW or more (EnEfG section 11). The EU rating scheme starts its A class at 1.15, but it is not in force.
Where the overhead goes
PUE (power usage effectiveness) is the energy a facility uses in a year divided by the energy its IT equipment uses (Data Center Metrics Task Force, 2011). A PUE of 1.5 means 0.5 kWh of overhead for each kWh of IT. Anyone who searches how to reduce data center PUE is asking how to shrink that 0.5 (our glossary defines the terms). The overhead share of the total is (PUE minus 1) divided by PUE: 33% at 1.5, 23% at 1.3 and 13% at 1.15*.
A worked example with round numbers. Take a hall at PUE 1.6 with 1,000 kWh of IT energy, so 600 kWh of overhead. The NOAA research computing centre has a calculated PUE of 1.60. Its estimated overhead splits into 78% cooling and fans, 15% UPS and power-distribution losses, and 7% generator heater and lighting (laboratory’s Table 1). Applied to the hall, that is 468 kWh for cooling and fans, 90 kWh for the power chain (the UPS and the transformers and distribution units that feed the racks) and 42 kWh for the rest*.
A cut of one quarter in cooling and fans saves 117 kWh and takes PUE from 1.60 to 1.48*. Reaching 1.3 needs the overhead to fall to 300 kWh. The power chain and lighting hold only 132 kWh between them, so cooling has to carry most of the cut. The three federal sites show the same pattern: cooling and fans took 60% to 66% of overhead and distribution losses took 18% to 25%* (federal study). They were assessed in 2012.
The measures and what they measured
The rows follow the ladder in the next section. Measured means the operator or a laboratory recorded the result at a site. Estimate means a laboratory forecast it. Vendor means the seller reported it. Only the US laboratory studies come from a third party. Most cases date from 2010 to 2018, and we found no newer case with a measured PUE. Figures marked * are our calculation from the cited numbers. The reading rule below says how to compare rows.
One rule explains several rows. Fan power varies with the cube of speed (ENERGY STAR), so 90% speed needs 73% of the power, 80% needs 51% and 50% needs 12.5%*. Real savings are smaller at low speed because of motor and drive losses.
| Measure | Loss it attacks | Documented result | Conditions | Site types |
|---|---|---|---|---|
| Containment, solid tiles, slower fans and a higher set point, applied together | Over-supply of cold air; bypass air that forces cold supply | Measured, self-reported (Facebook Engineering, 4 Nov 2010): 2,876,360 kWh a year saved and annual demand cut by 329 kW (about USD 273,000 a year). No PUE reported. | Smaller, recently built site; rooftop DX units (air-cooled, with compressors) with variable-speed fans and an air-side economiser; location not named. IT load fell between the before and after periods. The share from containment alone is not separated. | Air-cooled halls with underfloor supply |
| Solid tiles replacing perforated tiles; supply fans from 100% to 80% speed | Supply-fan energy | Measured, self-reported (same post, 2010): supply-fan motor demand down by 69 kW. | Same site. The cube law predicts about 49% less fan power for 20% less speed*. | Halls that over-supply air |
| Switch off surplus CRAH units | Duplicate fan and cooling energy | Measured, annualised by the laboratory (US DOE FEMP and LBNL, May 2014): 35% of CRAH units off, no considerable change in IT air-intake temperature, 1,300 MWh a year saved (about USD 75,000). | Federal site DC3: 1,824 kW IT, PUE 1.78. Two-week assessment in summer 2012. The report also lists sealing of floor and rack openings and PDU skirts among its air-management measures. | Legacy rooms with surplus air handlers |
| Raise the supply set point from 51 °F (10.6 °C*) to 67 °F (19.4 °C*) | Compressor energy; few free-cooling hours | Measured, self-reported (Facebook Engineering, 2010): free-cooling hours up from 2,200 to 6,800 a year; DX demand down by 260 kW. | Containment already in place. A start of 10.6 °C is very low, so a site that starts at 20 °C or above gains less. | Air-cooled DX with an economiser option |
| Higher chilled-water and supply-air temperatures, with dry coolers | Chiller compressor energy | Estimate (US DOE FEMP and LBNL, about 2014): PUE 1.60 to 1.51 with dry coolers and to 1.33 with higher temperatures; annual energy 11,190 to 9,280 MWh at 7,000 MWh of IT. | Forecast from a monitored baseline at a 6 MW research centre in West Virginia. Hot-aisle containment and rear-door heat exchangers already in place. The report also gives 1.62 to 1.33 in its summary, so we use its Table 1. Rule of thumb in the report: chiller efficiency improves about 1.5% per °F of set point (about 2.7% per °C*). | Chilled-water halls, high density |
| Water-side economiser or dry coolers | Chiller compressor energy | Estimate (same report): compressor-free hours up from 4,500 to 5,900 a year, which is 51% and 67% of the year*. | Dry coolers were not running during the assessment because ambient air was warm. A caution from site DC3 (federal study): an economiser had been installed but not piped into the chilled-water loop. | Chilled-water plants |
| Air-side free cooling with equipment rated for class A2 | Compressor energy | Theoretical map (The Green Grid, 2012): free air cooling for all 8,760 hours of a typical year in 97% of European locations (the abstract; the body says 99%). | Weather bin data from airport stations. Assumes IT equipment rated for ASHRAE class A2 (allowable air to 35 °C) and an operator who accepts the excursions. | New or rebuilt halls with suitable equipment |
| Economiser, evaporative cooling and a contained hot aisle | Compressor and fan energy | Measured, presented as slides (NREL, about 2011 to 2012): PUE 1.1 to 1.2 in winter, spring and autumn; 1.2 to 1.4 in summer. | Golden, Colorado (dry climate, high altitude). A 1,900 sq ft room, unusually efficient. Operating-mode hours are design bin hours, not metered. Not representative of a colocation hall. | Small, purpose-built rooms |
| Chilled-water plant control fix: tank flow cut from 1,000 to 300 US gallons a minute | Chiller and pumping energy | Measured (same NOAA report): one chiller shut down, pump energy fell, and PUE “improved immediately”. The size is shown only in a chart. | Building-automation data from the baseline period. A controls change, not new equipment. | Chilled-water plants with thermal storage |
| Machine-learning control of the cooling plant | Cooling-plant energy under fixed rules | Operator-reported (Google DeepMind, 20 Jul 2016): up to 40% less cooling energy, equal to a 15% cut in PUE overhead. At 15% of overhead, PUE 1.12 becomes 1.102*, 1.30 becomes 1.255* and 1.50 becomes 1.425*. | One live Google site. The post shows a typical day of on and off tests. No test duration, baseline PUE or site name is given. | Large sites with dense sensor data |
| Switch off surplus UPS modules to raise load factor; lighting controls | UPS low-load losses; lighting | Estimate (US DOE FEMP and LBNL, May 2014): UPS measure costs USD 30 to 70 per kW of IT with a 1.9-year payback; lighting costs USD 2 to 6 per sq ft with a 2.2-year payback. At NOAA, lighting energy falls from 160 to 45 MWh a year with controls (NOAA report). | Assessment estimates, not outcomes. | Sites with redundant UPS modules |
| More efficient UPS; eco mode | UPS conversion loss, which also becomes heat to cool | Vendor datasheet (Vertiv, about 2018 to 2019): at 1,000 kW of load, losses of 63.8 kW at 94% efficiency, 30.9 kW at 97% and 10.1 kW at 99%. Eco mode: about 0.06 PUE, a Green Grid estimate relayed by a trade article (2015, secondhand). | Nameplate values at a stated load, not site measurements. Eco mode exposes the load to raw mains. | Any site with double-conversion UPS |
| Airflow, set points, economiser, UPS and lighting as one package | All categories of overhead | Estimate (US DOE FEMP and LBNL, May 2014): PUE 1.80 to 1.45, 2.07 to 1.55, 1.78 to 1.38. Air-management package USD 80 to 220 per kW of IT, payback about 2 years; economiser package USD 130 to 360 per kW of IT, payback 2.3 years. | Forecasts from a summer 2012 snapshot. Sites of 420 to 1,824 kW of IT. Not a measured before and after. | Federal-type rooms |
| Consolidation into one hall with sealed hot aisles, efficient UPS and PDUs | Air mixing, overcooling, UPS and PDU losses, two separate rooms | Operator-reported (US DOE FEMP, 2018): PUE from more than 2 to 1.27; mechanical energy down 50%; calculated saving USD 37,594 a year. | A USD 8.3 million construction project, not one measure. Coastal Virginia. Measurement method and period not stated. The baseline is given only as “more than 2”. | Rebuilds and consolidations |
| Direct-to-chip liquid cooling for 75% of the IT load, plus optimisation | Server fans, room fans, chiller energy through warmer coolant | Vendor analysis (Vertiv, 3 Mar 2023): total power down 10.2%, non-IT power down 18.1%, PUE down only 3.3% (1.38 to about 1.33). | Analysis by a company that sells liquid cooling; the post does not say whether it was modelled or measured. Rack density not stated. Server-fan power counts as IT, so IT power fell 7%. | High-density halls |
| Immersion cooling | Server fans and air handling | No primary measured before-and-after PUE found. | Vendor claims exist but we could not trace any to a primary source, so we quote none. | Not assessed |
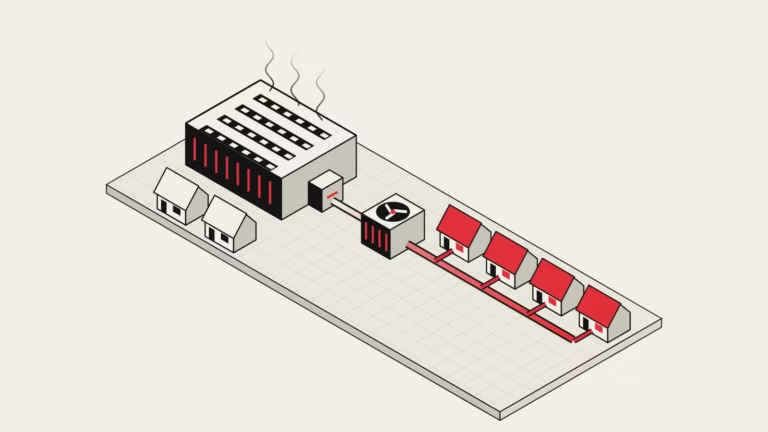
| Heat reuse | None: offsets energy used elsewhere | No effect on PUE (Task Force, 2011; JRC, 2025). | Exception: using waste heat inside the boundary, for example to warm a battery room, cuts HVAC energy and so lowers PUE. ERE is the metric that credits reuse. | Any site with a heat customer |
Warmer supply air also raises server fan power, and the JRC guidance tells buyers to ask vendors for total system power across the full allowed inlet temperature range. That fan power sits inside IT energy, so by our reading PUE can improve by more than total energy falls. How warm can supply air go? The ASHRAE 2021 thermal guidelines recommend 18 to 27 °C dry bulb (ordinary thermometer temperature) for equipment classes A1 to A4, and allow 15 to 32 °C for class A1 and 10 to 35 °C for class A2.
The order by site type
A CRAC (computer room air conditioner) cools air with its own compressor. A CRAH (computer room air handler) uses chilled water. For a legacy room with either, work down this list in order. The JRC guidance adds that you should take expert advice before changing the environmental range. The results for each step are in the table.
- Seal and contain. Fit blanking plates and close floor and rack openings. Then contain the aisles. Our post on cold and hot aisle containment covers the choice and has its own EnEfG worked case.
- Slow the fans and switch off surplus units.
- Raise supply and chilled-water temperatures inside the equipment’s allowed range.
- Use the economiser, check that it is connected to the loop, and fix plant controls.
- Raise the UPS load factor, then lighting.
Colocation hall. We found no site-level before-and-after case from a colocation operator. The public series is the fleet average: Equinix reports 1.54 in 2019 and 1.39 in 2024 (SEC annual report, fiscal 2024), with the boundary not stated. The ladder applies to existing halls. Occupancy matters as much: the JRC calls running at part capacity one of the largest sources of inefficiency. Our EU PUE benchmarks by size and country show where a given hall stands.
Hyperscale. Google’s fleet average moved from 1.20 in 2008 to 1.09 in 2025 (Google efficiency report). Its published control case is the DeepMind result in the table. A 15% cut in overhead is worth 0.018 PUE at 1.12 and 0.075 at 1.50*.
Small or edge site. The evidence is thin: the one small room we opened, at NREL, sits in a dry climate at altitude. A site below 300 kW of non-redundant connected load falls outside the EnEfG section 11 limits (EnEfG section 3).
Retrofit or replace the CRAC units
No source we opened compares a retrofit with a CRAC replacement at the same site. Retrofits that change airflow, fan speed or set points have measured results, listed in the table. The one large reported fall, at Jefferson Lab, came with a full consolidation and a USD 8.3 million budget, and the report does not split the result by measure. Its calculated saving is small against that budget, which suggests the project had goals beyond energy (our reading).
The sources give no efficiency figure for new CRAC units, so we cannot say what a like-for-like swap saves. They do give costs: at USD 80 to 220 per kW of IT, air management costs USD 80,000 to 220,000 for a 1,000 kW hall*. A design PUE for new equipment is a lower bound: Lawrence Berkeley National Laboratory (2024) says simulated PUEs assume equipment is commissioned and runs as designed, and that actual PUEs are likely not as good.
Before you commit to a retrofit or a replacement, ask the vendor or the case author four questions. The answers decide whether a quoted result applies to your hall.
- Which annual PUE was the baseline, and at which measurement category?
- Was IT load the same in the before and after periods? Facebook’s own post notes that a load drop distorted its comparison.
- Which other measures were bundled into the result?
- Is the number measured, or is it a forecast?
When a lower PUE is not a saving
The reading rule for every PUE in this article, and in any case you are shown: compare numbers only when they are annualised, the IT load is comparable, the measurement boundary is named and the climate is named. The paragraphs below take each condition in turn, then cover three cases where a lower number means no saving.
Annualised. The Task Force recommends twelve months of kWh. A category 0 reading is a peak-demand snapshot and can miss fluctuating loads (Task Force, 2011). Google’s Mayes County campus reports quarterly PUE of 1.09 in the first quarter of 2025 and 1.16 in the second (Google).
Boundary. Category 1 measures IT at the UPS output, category 2 at the PDU output and category 3 where the IT device connects. A PUE should carry its category as a subscript, such as PUE2. EN 50600-4-2 introduced these categories (EVS scope note). A PUE that counts only IT and cooling is a partial PUE and must be labelled as one (Green Grid, 2012).
Climate. At the end of 2025 Google’s campuses ranged from 1.04 to 1.14: 1.04 to 1.06 in central Ohio, 1.07 in the Netherlands, 1.08 in Belgium and Ireland, and 1.12 to 1.14 in Singapore (Google, year-end 2025). Uptime reports that many new sites in high-latitude North America and Europe reach 1.3 or better (Uptime, 2025).
Load. Fixed overhead, such as UPS no-load loss and always-on cooling, spreads over less IT energy in an emptier hall. The Green Grid says virtualisation can lower IT load and raise PUE for this reason (White Paper 49). The table below is our own illustration, not a measurement. It assumes proportional overhead of 20% of IT load and fixed overhead of 20% of full IT load. Real curves flatten because fan and pump power fall with load.
| IT load | 100% | 75% | 50% | 25% | 10% |
|---|---|---|---|---|---|
| PUE | 1.40 | 1.47 | 1.60 | 2.00 | 3.20 |
A new site shows the same effect: Google’s 2008 report says PUE was high and volatile while chillers ran against a small IT load in commissioning (Google, 2008 archive). The EU scheme provides for an explanatory document from the Commission with each label, covering how PUE changes with commissioning or occupancy (Annex II).
The IT denominator. When servers become more efficient, IT energy falls. PUE can then rise although total energy falls. The 2013 paper by Patterson and colleagues gives the example. Two halls have identical infrastructure of 1.98 MW and PUE 1.6 with 10,000 servers at 330 W. If the servers draw 266 W, IT falls from 3.30 MW to 2.66 MW, PUE rises to 1.74, and total site power falls from 5.28 MW to 4.64 MW. The paper’s own metric, TUE, which also judges the efficiency inside the servers, improves from 2.67 to 2.33. The example assumes the infrastructure power does not scale down. Moving fans out of the servers, as liquid cooling does, shifts energy from the IT side to the overhead side in the same way.
Water and heat. Two sites can share a PUE and differ widely in water use: OVHcloud’s Gravelines and Beauharnois sites both report PUE 1.21, with WUE (litres of site water per kWh of IT) of 0.20 and 0.86 (OVHcloud, fiscal 2025). Heat reuse does not lower PUE, because heat sent outside the boundary leaves PUE unchanged. ERE (energy reuse effectiveness) credits it: ERE = (1 – ERF) x PUE, where ERF is reused energy divided by total energy (arXiv review of Green Grid White Paper 29, secondhand). A site at PUE 1.3 that exports 20% of its energy as heat has an ERE of 1.04*.
Where PUE stops working
Liquid cooling is the clearest case. In the Vertiv analysis, a move from air to 75% direct-to-chip liquid cooling cut total power 10.2%, but PUE fell only 3.3%, because server fan power left the IT side (Vertiv, 2023). Vertiv sells liquid cooling, and it says PUE should not be used to compare liquid and air systems. Compare total site energy for equal compute output instead. Our liquid cooling reference covers the engineering.
Liquid cooling can run warmer coolant, which allows more free cooling. The JRC lists direct liquid cooling as an optional practice. The 2024 US report projects a modelled US average PUE of 1.15 to 1.35 by 2028, helped by liquid-cooled AI servers (LBNL, 2024). We found no primary measured PUE for immersion cooling, so we state none.
For new German data centres starting from 1 July 2026, EnEfG section 11 requires PUE 1.2 or lower and a reused-energy share of at least 10%, with 15% planned from 1 July 2027 and 20% from 1 July 2028. The power of plant used only to upgrade waste heat is excluded from the legal PUE.
The EU rating scheme (C(2026) 3472) sets PUE classes from A at 1.15 or lower to G above 1.9 (Annex I). Under Article 3 of the act, the European database must generate and issue each label by 15 August 2027 (the act). It is adopted but not in force: Parliament extended its scrutiny period on 6 October 2026 (procedure file). Our post on the rating label tracks the scheme, and the EED KPI calculator works out the reporting indicators for a site.
How the floor moved
The Uptime survey average fell from 2.5 in 2007 to 1.65 in 2014 as operators made the most practical changes first: electrical upgrades, airflow management and cooling controls. It then stood nearly still, at 1.54 in 2025 (n=681), the sixth year of virtually no change (Uptime Institute, 2025). Sites commissioned in the last five years average 1.48, and sites of 20 MW or more average 1.44. The survey is self-reported and its mix of sites changes each year.
How to cite this page
ScienceShot, How to Reduce Data Centre PUE, updated 12 October 2026. Rows labelled Estimate, Vendor or secondhand are forecasts or reports by interested parties, not independent measurements.
Sources
- Facebook Engineering, New Cooling Strategies for Greater Data Center Energy Efficiency, 4 November 2010
- US DOE FEMP and Lawrence Berkeley National Laboratory, Case Study: Opportunities to Improve Energy Efficiency in Three Federal Data Centers, May 2014
- US DOE FEMP and Lawrence Berkeley National Laboratory, Case Study: Innovative Energy Efficiency Approaches in NOAA’s Environmental Security Computing Center, about 2014
- US DOE FEMP, 2018 Award-Winning Champion Lessons Learned Case Study: Thomas Jefferson National Accelerator Facility, 2018
- European Commission Joint Research Centre, 2025 Best Practice Guidelines for the EU Code of Conduct on Data Centre Energy Efficiency (JRC141521), 2025
- US EPA and DOE ENERGY STAR, Replace Standard Fans with Variable Speed Fans (page read 12 October 2026)
- ASHRAE TC 9.9, 2021 Equipment Thermal Guidelines for Data Processing Environments, Reference Card, fifth edition
- The Green Grid, White Paper 46: Updated Air-Side Free Cooling Maps, 2012
- NREL, Research Support Facility Data Center Case Study (slides, undated, about 2011 to 2012)
- Google, Efficiency, PUE Yearly Report 2025 and 2008 archive (page read 12 October 2026)
- Lawrence Berkeley National Laboratory, 2024 United States Data Center Energy Usage Report (LBNL-2001637), December 2024
- OVHcloud, PUE, WUE, REF values, fiscal year 2025
- Vertiv, Understanding the limitations of PUE in evaluating liquid cooling efficiency, 3 March 2023
- Patterson et al., TUE, a new energy-efficiency metric applied at ORNL’s Jaguar, ISC 2013 (LNCS 7905)
- Vertiv, High efficiency modes of operation (Liebert white paper, undated, about 2018 to 2019)
- Consulting-Specifying Engineer, Evaluating UPS system efficiency, 11 June 2015
- The Green Grid, White Paper 49: PUE, A Comprehensive Examination of the Metric, 2012
- Google DeepMind, DeepMind AI reduces Google data centre cooling bill by 40%, 20 July 2016
- Data Center Metrics Task Force (May 2011), Recommendations for Measuring and Reporting Overall Data Center Efficiency, Version 2
- arXiv:1208.0593, The Green Grid saga, a review (2012), for the ERE formula
- Uptime Institute, Global Data Center Survey 2025 (Keynote Report 180), July 2025
- Equinix, Annual Report to Shareholders for fiscal 2024 (Form ARS), environmental data
- Estonian Centre for Standardisation, EVS-EN 50600-4-2:2016, scope
- Energieeffizienzgesetz (EnEfG) section 3, definitions (read 12 October 2026)
- Energieeffizienzgesetz (EnEfG) section 11, Klimaneutrale Rechenzentren (read 12 October 2026)
- European Commission, Annexes to the Delegated Regulation establishing a Union rating scheme for data centres, C(2026) 3472, 21 September 2026
- European Commission, Delegated Regulation establishing a Union rating scheme for data centres, C(2026) 3472, Article 3 (Council document ST-13444-2026-INIT)
- European Parliament Legislative Observatory, procedure file 2026/2895(DEA)
Cite this article
Editorial, S. (2026, March 7). How to Reduce Data Centre PUE: Measures and Real Results. ScienceShot. https://scienceshot.com/post/the-efficiency-horizon-a-historical-analysis-of-how-to-improve-data-center-pue
Editorial, ScienceShot. “How to Reduce Data Centre PUE: Measures and Real Results.” ScienceShot, 7 Mar. 2026, scienceshot.com/post/the-efficiency-horizon-a-historical-analysis-of-how-to-improve-data-center-pue.
Editorial, ScienceShot. “How to Reduce Data Centre PUE: Measures and Real Results.” ScienceShot, March 7, 2026. https://scienceshot.com/post/the-efficiency-horizon-a-historical-analysis-of-how-to-improve-data-center-pue.
@online{scienceshot-the-efficiency-horizon-a-2026,
  author       = {Editorial, ScienceShot},
  title        = {{How to Reduce Data Centre PUE: Measures and Real Results}},
  organization = {ScienceShot},
  date         = {2026-03-07},
  year         = {2026},
  url          = {https://scienceshot.com/post/the-efficiency-horizon-a-historical-analysis-of-how-to-improve-data-center-pue}
}
https://scienceshot.com/post/the-efficiency-horizon-a-historical-analysis-of-how-to-improve-data-center-pue
Get the weekly brief
Sourced analysis of data-centre engineering and regulation, every Monday. No spam, unsubscribe any time.