Key takeaways
- Data pulses in standard single-mode fibre travel at about 204,107 km/s, which is 68.1% of the vacuum speed of light.
- A data pulse follows the group index (1.4626 for bulk silica at 1550 nm), not the phase index (1.4440).
- The zig-zag path of light inside the fibre adds about 0.46% by a crude ray-optics estimate, so it explains almost none of the 31.9% slowdown.
- Between London and Frankfurt (637.76 km) a signal needs at least 6.2493 ms round trip in fibre, against 4.2547 ms in a vacuum.
- Hollow-core fibre that Microsoft calls 47% faster takes about 32% less time, and Cat 6A copper cable with a velocity factor of 68% to 74% takes between 0.1% more and 8% less time than glass.
If you play online games, you know the difference between a server in your own country and one on another continent. The near one answers at once. The far one lags, whatever speed your internet plan advertises.
It is often said that the signal in the cable moves at the speed of light. Light in a vacuum does travel at 299,792.458 km/s. A pulse of data in standard optical fibre, the glass thread that carries light signals, travels at about 204,107 km/s. That is 68.1% of the vacuum figure.
Why does clear glass hold light back, and by exactly this much? And what does 68.1% do to the time a message needs between two data centres, the buildings full of servers that store the internet’s data?
Two explanations that fail, and the one that works
The first explanation is the one from school. Light bounces from wall to wall inside the glass thread, so its path is longer than the cable, and the longer path costs time. That picture fits multimode fibre, a thick fibre where light takes many paths at once. The fibre sold for carrier and data centre links, such as Corning’s SMF-28 Ultra, is single-mode. The core of the SMF-28 family, the strand of glass that carries the light, is about 8.2 micrometres wide (a micrometre is a thousandth of a millimetre), and it supports one pattern of light only. RP Photonics notes that pulse spreading between different paths cannot occur in such a fibre.
Apply the bouncing picture anyway. Corning lists a numerical aperture of 0.14 for its SMF-28 Ultra fibre, a measure of the steepest angle at which the core can still trap light. Taking Corning’s 1.4682 (an effective group index, used here as a stand-in for the core index) and the numerical aperture of 0.14 (measured at 1310 nm), the outer layer would have an index of about 1.4615. A ray at the steepest angle then covers 1.00458 times the distance of a ray down the middle, which is 0.46% extra or about 22 nanoseconds per kilometre. The estimate is crude, because it applies ray optics to a core only a few wavelengths wide. It still sets the scale. Bouncing explains under half a percent of a 31.9% slowdown.
The second explanation says each atom absorbs the light, holds it for a moment and sends it out again, and the waiting adds up. This is a common shortcut, and the standard classical treatment of refraction does not use it. In Feynman’s chapter on the origin of the refractive index, no photon (a single packet of light) is ever stopped and released. The electrons respond continuously to the passing wave.
What does happen is described in chapter 31 of Feynman’s Lectures on Physics. Inside glass, the electric field of the light pushes on the electrons bound to the atoms, and they oscillate at the light’s frequency. A moving charge radiates a field of its own, so every electron becomes a tiny new source of light. Each of those fields travels at the full speed c, with “these basic contributions of the field travelling at the ultimate velocity c”, in Feynman’s words.
The wave inside the glass is the sum of the original wave and all the radiated waves. Added to the original, the radiated waves shift the crests so that they arrive late. The crests then appear to move at c divided by n, where n is the refractive index, the factor by which a material slows the crests compared with a vacuum. The frequency stays the same, and the wavelength shortens from 1,550 nanometres to 1,073.4.
Feynman’s formula for the index rises with the number of charges per unit of volume, and it rises as the light’s frequency nears the natural frequency of the electrons. In glass that frequency lies in the ultraviolet, above the visible range. Blue light is closer to it than red, so glass has a higher index for blue, which is why a prism bends blue light more. He derives this for a thin medium where n is only just above 1 and postpones the dense case. The mechanism is the same.
Nothing here belongs to fibre alone. Every transparent material has electrons that respond to light, so each has an index above 1. Air at 20 °C, standard pressure and 50% humidity has n = 1.000268148 for 1550 nm light (the NIST calculator for the Ciddor equation), which slows that light by 0.027%. A cubic centimetre of glass holds far more charges than one of air.
Why a data pulse follows the group index
The index n describes the crests of a pure wave that never starts and never stops. A message is different. To carry data, the light is switched on and off, and a switched signal is a bundle of waves with slightly different frequencies added together. The outline of the bundle is its envelope. Feynman’s chapter on beats shows that the envelope can travel at a different speed from the crests inside it, and calls the envelope speed the group velocity. His chapter on the origin of the refractive index adds: “The node of a wave is not a signal by itself.” A node here is a marked point that moves with the wave, such as a crest, and it carries no message.
The two speeds differ because the index depends on wavelength. RP Photonics gives the group index as n minus the wavelength times dn/dλ, where dn/dλ is how fast the index changes as the wavelength grows. For bulk fused silica at 1550 nm, the Malitson formula as tabulated on refractiveindex.info gives n = 1.4440 and dn/dλ = minus 0.011982 per micrometre. The group index is then 1.4440 + 1.55 × 0.011982 = 1.4626. The crests move at 207,609 km/s. The pulse moves at 204,973 km/s.
Real fibre adds one more step. Its datasheet lists an effective group index, which accounts for the light being guided inside a core. Corning gives 1.4682 at 1550 nm for SMF-28 Ultra, as a typical value. FiberHome gives 1.4688 for its G.652.D fibre (G.652.D is an international ITU-T standard for single-mode fibre). Both sit about 0.4% above the bulk silica figure, and the size of the step depends on the fibre design.
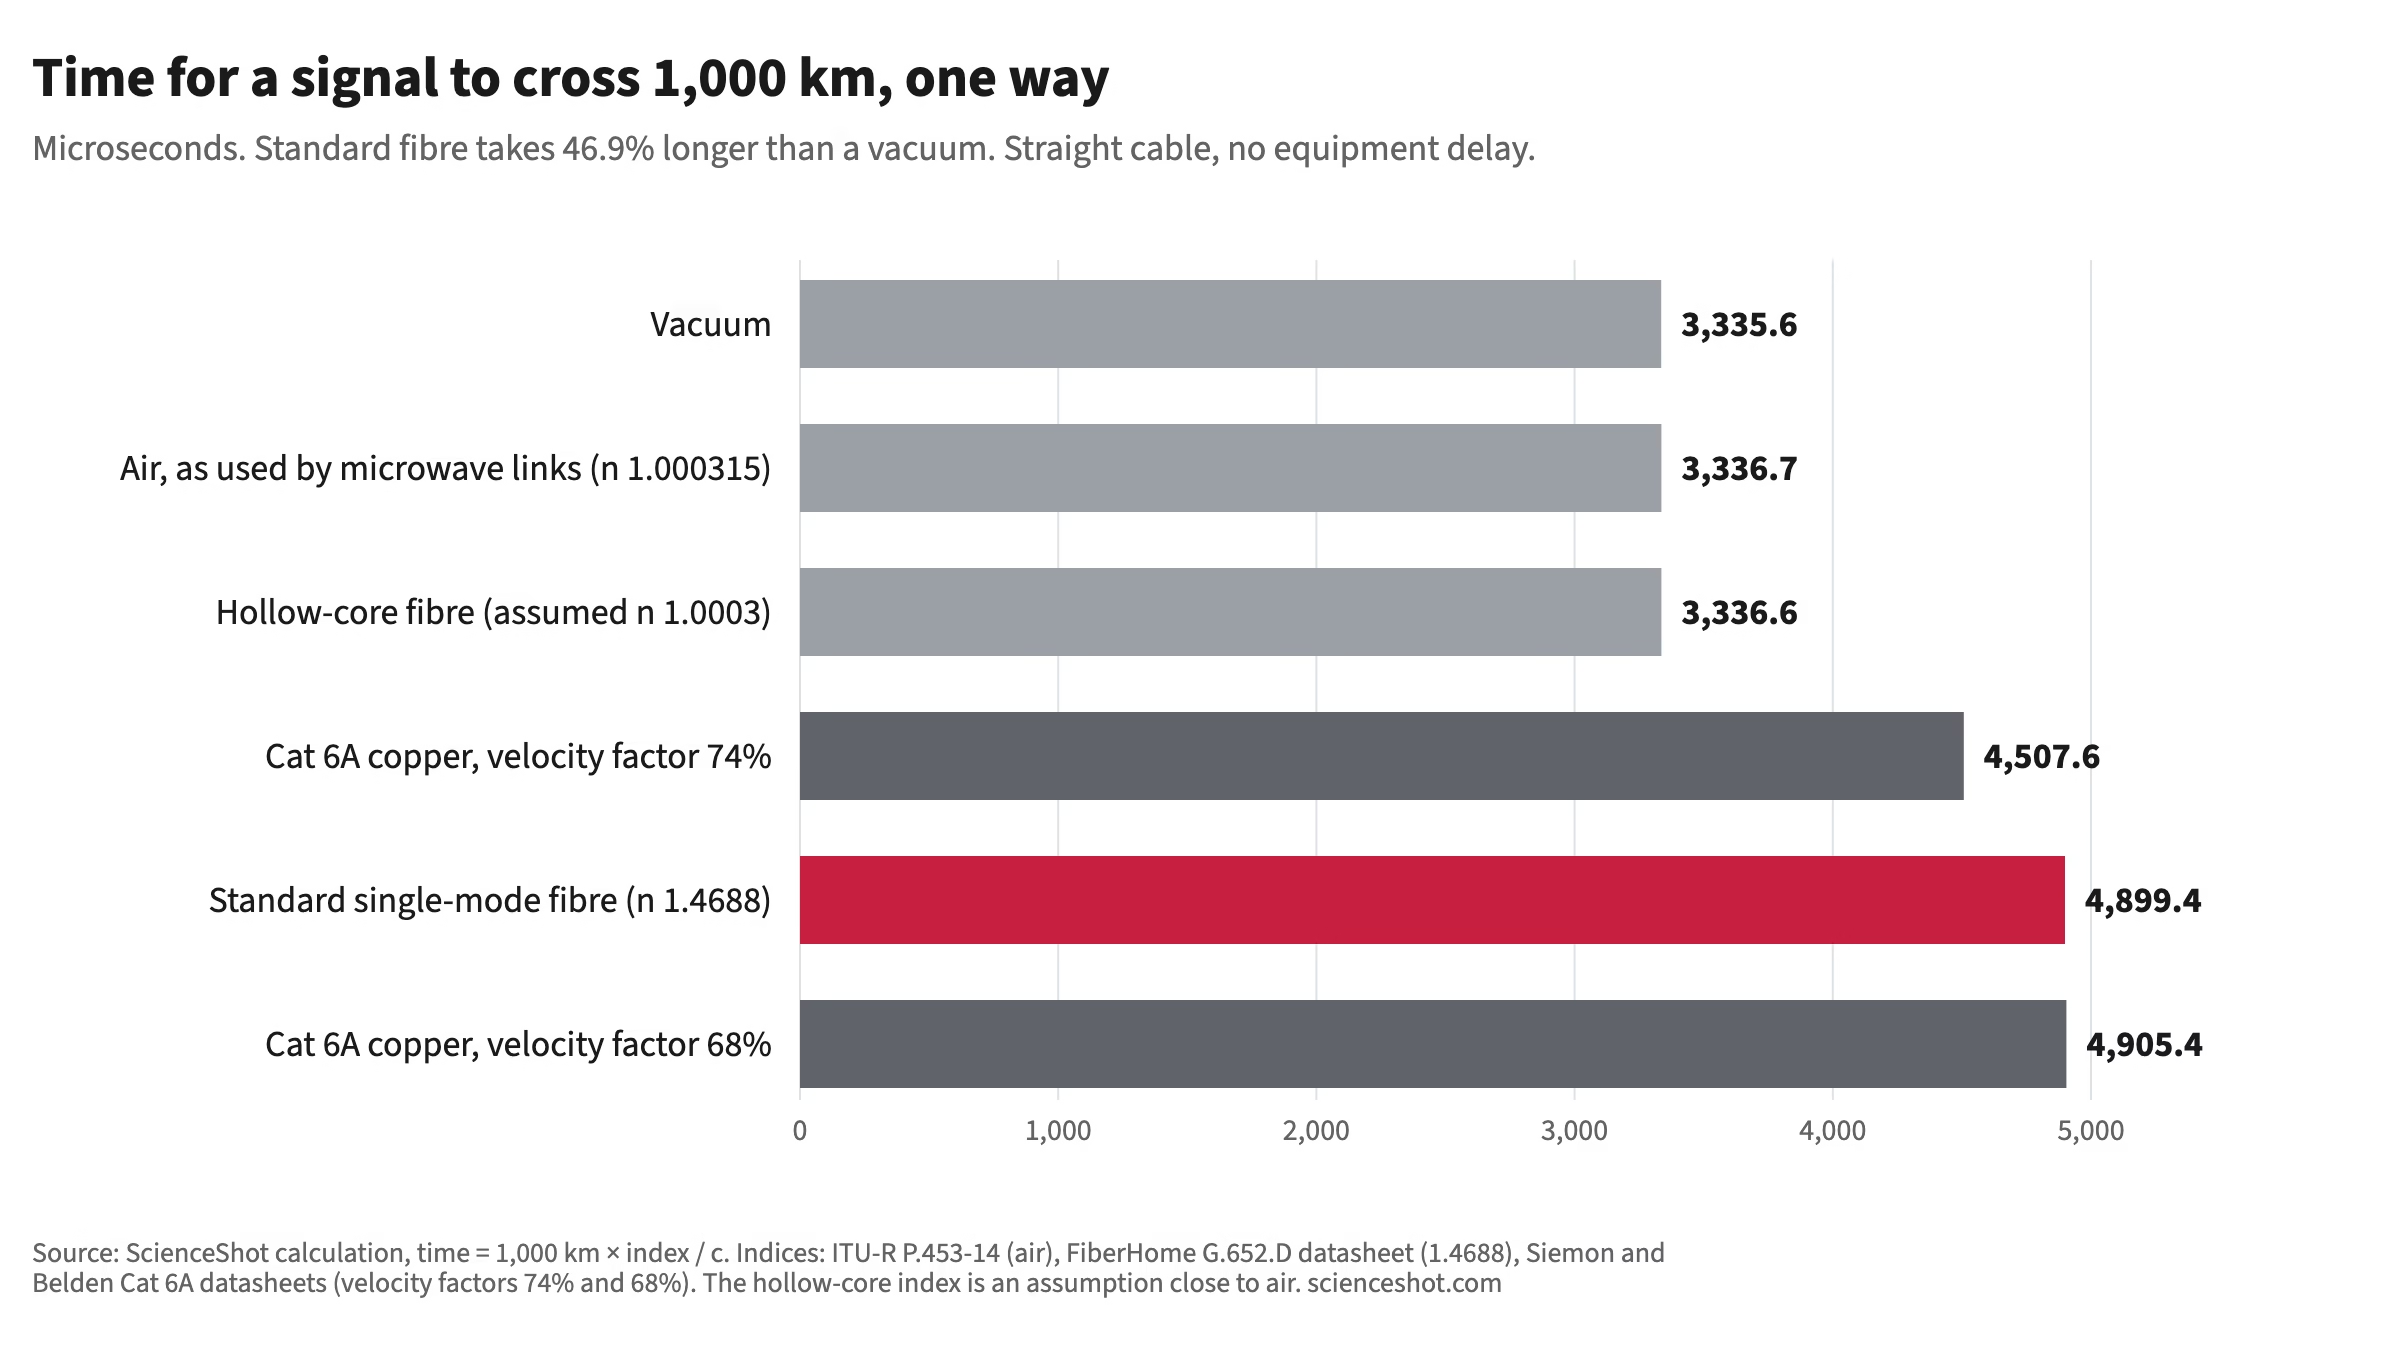
With 1.4688, the speed is 299,792.458 / 1.4688 = 204,107 km/s. One kilometre takes 4.8994 microseconds (a microsecond is a millionth of a second), so 1,000 km takes 4.8994 milliseconds (a thousandth of a second). A latency estimate built on the phase index 1.4440 would give 4.817 microseconds per kilometre, which is 1.7% too short for a data pulse.
London to Frankfurt in numbers
The great-circle distance is the shortest line along the curved surface of the Earth. Between London and Frankfurt, using city-centre coordinates, it is 637.76 km. In a vacuum, light needs 2.1273 ms to cover it one way and 4.2547 ms for the round trip, out and back, which is what a ping measures. In standard fibre the trip takes 3.1246 ms one way and 6.2493 ms round trip. The glass adds 0.9973 ms in each direction. These are minimums for a straight cable, not measured ping times.
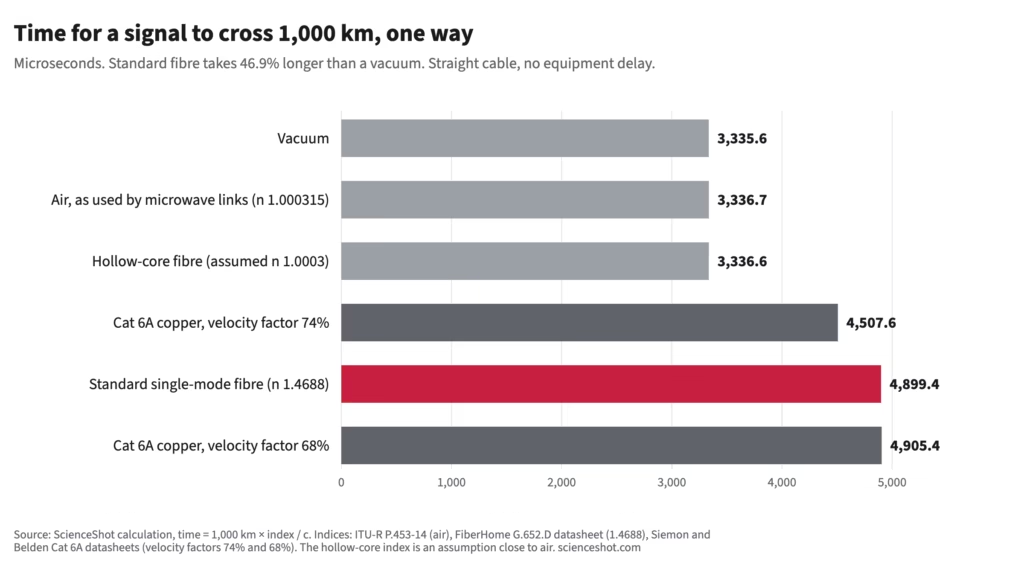
| Medium | Index used | Speed (km/s) | One-way time for 1,000 km (microseconds) |
|---|---|---|---|
| Vacuum | 1 | 299,792 | 3,335.6 |
| Air, as used by microwave links | 1.000315 | 299,698 | 3,336.7 |
| Hollow-core fibre (assumed) | 1.0003 | 299,703 | 3,336.6 |
| Standard single-mode fibre | 1.4688 | 204,107 | 4,899.4 |
| Cat 6A copper, velocity factor 74% | NVP 74% | 221,846 | 4,507.6 |
| Cat 6A copper, velocity factor 68% | NVP 68% | 203,859 | 4,905.4 |
Copper signals travel at a speed close to that of glass. The velocity factor (NVP, nominal velocity of propagation) is the share of c at which a signal moves along a cable. The Belden 10GX13 Cat 6A cable lists 68%, and the Siemon Cat 6A U/FTP cable lists 74%. At 68%, one kilometre takes 4.905 microseconds, about 0.1% slower than fibre. At 74% it takes 4.508 microseconds, 8.0% less than fibre. Siemon’s guaranteed worst case is 545 nanoseconds per 100 m at 10 MHz, with the limit running from 536 to 570 nanoseconds across the tested frequencies. The 545 figure equals 5.45 microseconds per kilometre, 11% more than fibre. Siemon states delay per 100 m, and over that length a 74% cable beats fibre by about 39 nanoseconds. In a data centre, the distance each can span and the delay in the equipment at the ends matter more than the speed in the cable.
Get the next one by email
Power, cooling, chips and the rules that shape them. No spam, unsubscribe any time.
Paths that avoid the glass: microwave and hollow-core fibre
Radio waves in air slow down very little. At sea level the radio refractive index is n = 1.000315, the global mean in ITU-R Recommendation P.453-14, so a radio link runs 0.0315% below vacuum speed. Traders noticed. Aurora, Illinois holds the CME matching engine and Carteret, New Jersey holds the Nasdaq one (a matching engine is the computer system where buy and sell orders meet). The sites are 1,179 km apart, and light in a vacuum needs 3.93 ms. Straight-line fibre at 1.4688 would need 5.776 ms.
Laughlin, Aguirre and Grundfest documented a 3 ms fall in one-way time between the two areas from April 2010 to August 2012. The authors attribute the first step to a latency-optimised fibre route and the second to microwave networks working mostly in the 6 to 11 gigahertz radio band. They quote the best fibre at 6.55 ms, measured from a Chicago site about 60 km nearer than Aurora, so subtracting 3.93 from it overstates the gap. Their microwave estimates run from 4.2 to 5.2 ms, and they expect better designs to approach 4.03 ms. The price was high: a total cost, including five years of operation, expected to exceed $500 million, and about 3.4 Gbps (billions of bits per second) of capacity shared by 15 networks, far below the terabits per second that fibre carries. The figures come from the 2013 preprint, and the 2014 journal version may differ.
Hollow-core fibre removes the glass from the path of the light, which travels in an air-filled channel. In 2025, Petrovich and colleagues reported in Nature Photonics a design of this kind with a measured loss of 0.091 decibels per kilometre at 1550 nm. A decibel per kilometre measures how fast power fades, and 0.091 means about 2.1% of the power is lost each kilometre. The best solid-silica fibres lose 0.14 decibels per kilometre. Our earlier article on hollow-core fibres covers the loss records.
Microsoft says its hollow-core fibre is 47% faster than silica glass (Azure blog, June 2024). In September 2025 it described its fibre as offering up to 47% faster data transmission and approximately 33% lower latency, maximum figures from a product announcement, and said the fibre has run in multiple Azure regions since 2023. Speed is distance divided by time, so the two numbers differ. If speed rises 1.47 times, time falls to 1 / 1.47 = 68.0% of what it was, a cut of 32.0%. With a group index near 1.0003 for the hollow core (the papers do not state one), 1.4688 / 1.0003 gives a speed gain of 46.8% and a time cut of 31.9%. Microsoft’s 33% is about one point generous. Between London and Frankfurt, a hollow-core link would need 2.1280 ms one way instead of 3.1246 ms, a saving of 0.9966 ms. These figures compare the medium and are not a measured route.
Real routes are longer than the straight line
Cables never run along a perfectly straight line, so every number above is a floor. Bozkurt and colleagues analysed the InterTubes map of long-haul fibre conduits in the United States, the buried pipes that hold the cables. They run 20% longer than the straight line in the median and 28% longer at the 95th percentile, the value that 95% of routes stay below. Equipment adds more delay. Measured Internet latency is in the median 3.1 times the vacuum minimum, which equals 2.1 times the straight-line distance at fibre speed, because 2.1 × 1.47 is about 3.1. A shortest-path route through those conduits could cut the 2.1 to 1.3.
Singla and colleagues found a similar result in 2014: a median ping time 3.2 times the vacuum minimum, measured from more than 400 well-connected research computers. For London and Frankfurt, a route factor of 1.2 (the US conduit median) turns 637.76 km into 765 km of cable. The minimum becomes 3.7496 ms one way and 7.4991 ms round trip. A factor of 2.1 gives 6.5617 ms one way and 13.1235 ms round trip. These cases illustrate the range and do not measure any real cable. Our article on fibre infrastructure for modern data centres describes the cabling at the end of these routes.
Try it with your own route
Open the ScienceShot fibre latency calculator. It uses the group index 1.4688 at 1550 nm for G.652.D fibre and c = 299,792.458 km/s, so its numbers match this article. Pick two of its 20 European hub cities, for example London and Frankfurt. Set Route to Straight line and read the minimum round trip: that is the physical floor. Then choose Custom factor and type 1.2, then 2.1, and watch how much of the delay comes from the cable’s length. The default setting, Mapped fibre (ITU), gives a longer path than the straight line for most pairs.
Now measure. If you live in or near one of those hub cities, open a terminal and run ping followed by the name of a server in another hub city whose location you know. The tool prints the round trip time in milliseconds. Divide the average by the calculator’s straight-line round trip minimum for that pair. In the US studies above, a result near 2.1 was typical. A ping also contains the time that equipment and the server need, so it can only sit above the minimum. If it comes out below, the server answering you is closer than the city you assumed.
The same arithmetic works for any material. Water has n = 1.3324 for light of 589.3 nanometres (Hale and Querry data), so light crosses it at 299,792.458 / 1.3324 = 225,002 km/s, which is 75.05% of c. A charged particle can move faster than that without passing the vacuum limit. When it does, it emits a cone of light. The US Nuclear Regulatory Commission calls this Cherenkov radiation, and the Particle Data Group states the condition as a speed above the local phase speed of light. For an electron in water the threshold is 0.7505 times c, a kinetic energy of 0.262 MeV (megaelectronvolts, an energy unit for particles). In the spent-fuel pools of nuclear reactors the result is a blue glow, which the NRC attributes mainly to fast electrons knocked loose by gamma rays from the fuel.
Sources
- Corning SMF-28 Ultra optical fiber product information, sheet PI1424 (July 2025)
- FiberHome, Low Water Peak Single-Mode Optical Fiber (G.652.D) datasheet
- Bozkurt et al., Dissecting Latency in the Internet’s Fiber Infrastructure, arXiv:1811.10737
- Singla et al., The Internet at the Speed of Light, ACM HotNets 2014
- Feynman Lectures on Physics, volume I, chapter 31, The Origin of the Refractive Index
- Feynman Lectures on Physics, volume I, chapter 48, Beats
- refractiveindex.info, fused silica (Malitson, 1965 formula)
- RP Photonics Encyclopedia: Group Index
- RP Photonics Encyclopedia: Single-mode Fibers
- ITU-R Recommendation P.453-14, The radio refractive index
- NIST Engineering Metrology Toolbox, refractive index of air (Ciddor equation)
- Laughlin, Aguirre and Grundfest, Information Transmission Between Financial Markets in Chicago and New York, arXiv:1302.5966
- Petrovich et al., Broadband optical fibre with an attenuation lower than 0.1 decibel per kilometre, Nature Photonics 19 (2025)
- Microsoft Azure blog, How hollow core fiber is accelerating AI (25 June 2024)
- Microsoft Azure Networking blog, Azure scales Hollow Core Fiber production (23 September 2025)
- Siemon Category 6A U/FTP 4-pair cable spec sheet 200_01051
- Belden 10GX13 datasheet
- US NRC, Interaction of Charged Particles With Matter (training slides, ML11229A666)
- Particle Data Group, Passage of Particles Through Matter, section 34.7.1
- refractiveindex.info, water (Hale and Querry, 1973)
Cite this article
Mitchell, J. (2026, October 13). Why data in optical fibre is 32% slower than light. ScienceShot. https://scienceshot.com/post/why-light-in-fibre-is-slower
Mitchell, John. “Why data in optical fibre is 32% slower than light.” ScienceShot, 13 Oct. 2026, scienceshot.com/post/why-light-in-fibre-is-slower.
Mitchell, John. “Why data in optical fibre is 32% slower than light.” ScienceShot, October 13, 2026. https://scienceshot.com/post/why-light-in-fibre-is-slower.
@online{scienceshot-why-light-in-fibre-2026,
  author       = {Mitchell, John},
  title        = {{Why data in optical fibre is 32\% slower than light}},
  organization = {ScienceShot},
  date         = {2026-10-13},
  year         = {2026},
  url          = {https://scienceshot.com/post/why-light-in-fibre-is-slower}
}
https://scienceshot.com/post/why-light-in-fibre-is-slower
Get the weekly brief
Sourced analysis of data-centre engineering and regulation, every Monday. No spam, unsubscribe any time.